Stanley Cup Finals Preview
A deep dive into the Stanley Cup Finals matchup between the Vegas Golden Knights and Florida Panthers
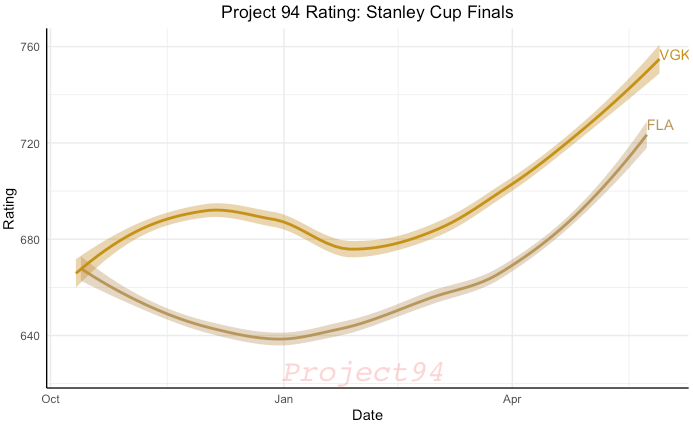
Stanley Cup Finals: Vegas Golden Knights (1) vs Florida Panthers (WC2)
Series Prediction: FLA
Conn Smythe Pick: Sergei Bobrovsky
Game 1 Win Probability (Saturday, June 3rd 8:00PM ET)
VGK: 54.256%
FLA: 45.744%
The Stanley Cup Finals are here, and as most agree, the matchup is not one many predicted. The Vegas Golden Knights, the #1 seed in the Western Conference, will face the Florida Panthers, the 2nd Wild Card seed in the Eastern Conference. These 2 faced each other twice in the regular season, both games favoring the home team, and while Florida has been applauded for making an incredible run as the underdog in each round, they will face a very strong Vegas team.
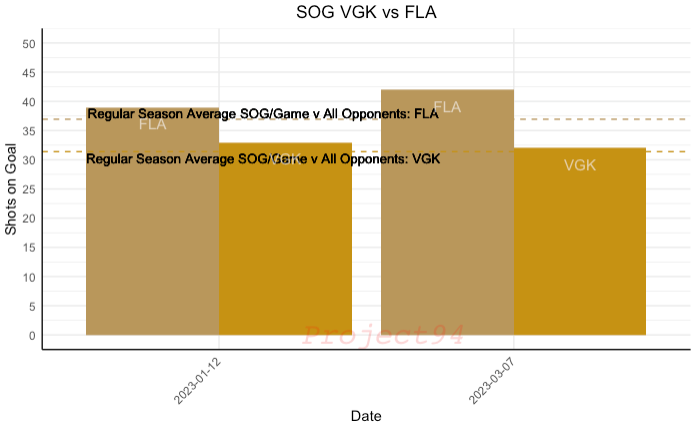
| Date | Home Team | Away Team | Final Score | Win Probabilities |
|---|---|---|---|---|
| 01-12-2023 | VGK | FLA | 4:2 | 59.7% : 40.3% |
| 03-07-2023 | FLA | VGK | 2:1 | 48.0% : 52.0% |
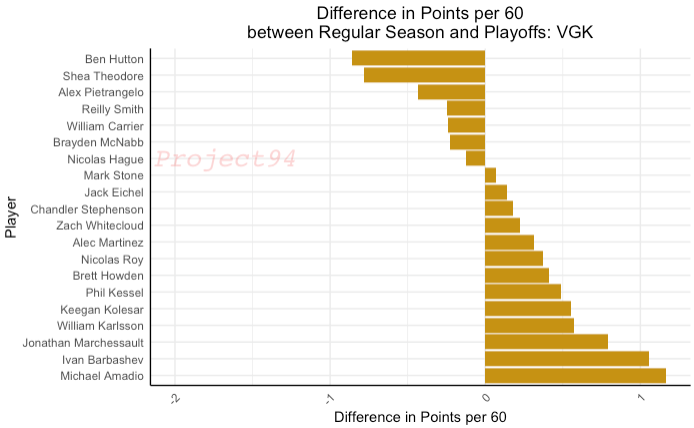
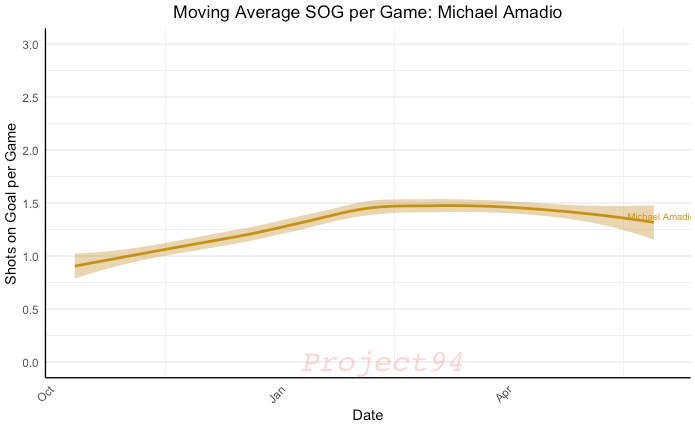
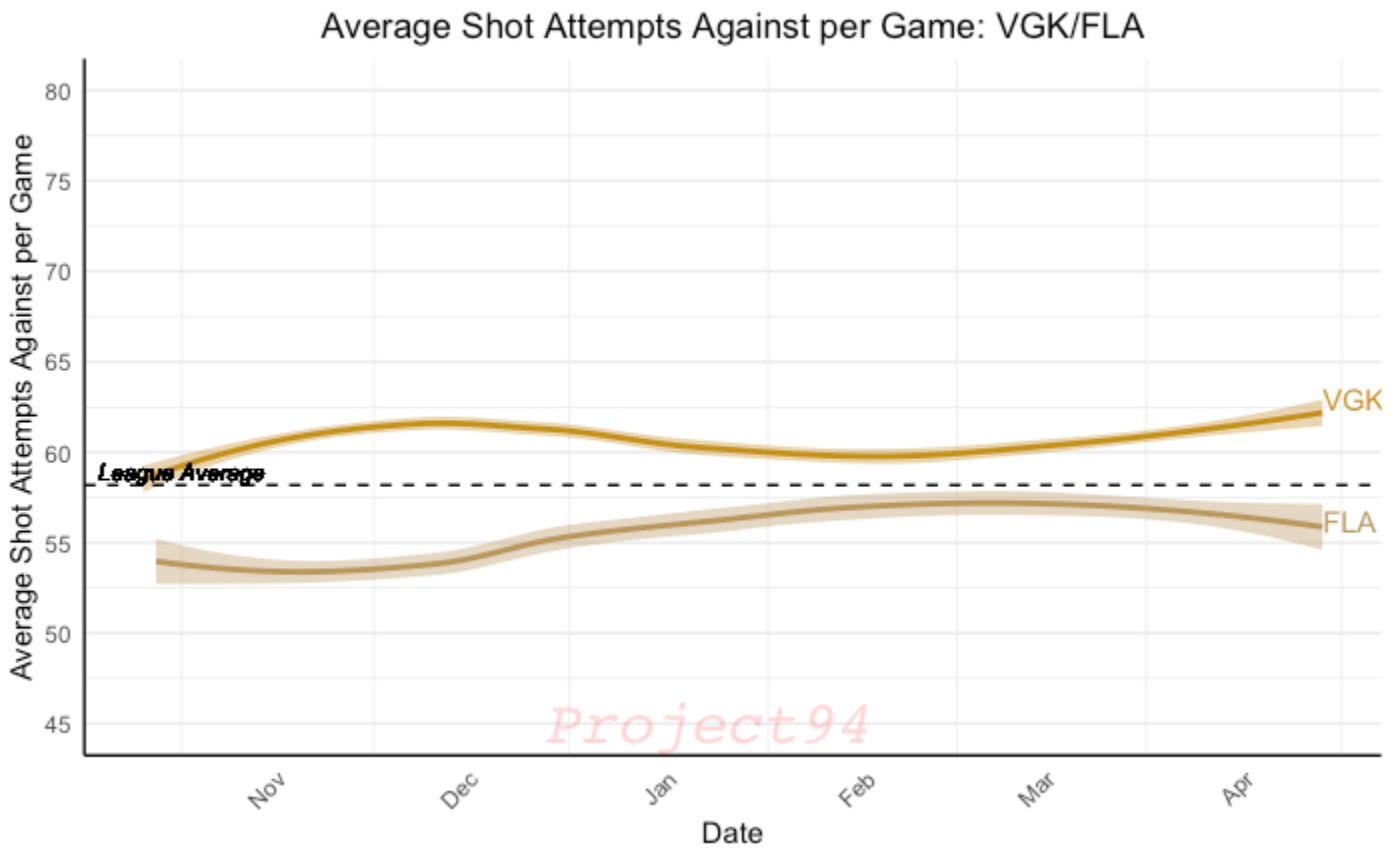
The head to head matchup in offense leans Florida. The Panthers not only outshot the Knights in both regular season games between the two, they also led the league in the regular season with 36.9 Shots per game. While Florida dropped to 31.7 shots per game in the playoffs, Vegas was behind them in both the regular season and playoffs. However, Vegas has averaged 3.6 goals per game in the playoffs (up from 3.3 in the regular season) to Florida's 3.1 goals per game. Vegas' increase in goals has partly stemmed from an increase in production from players down the lineup like Michael Amadio, who has 3 goals and 4 assists in 11 games in the playoffs.
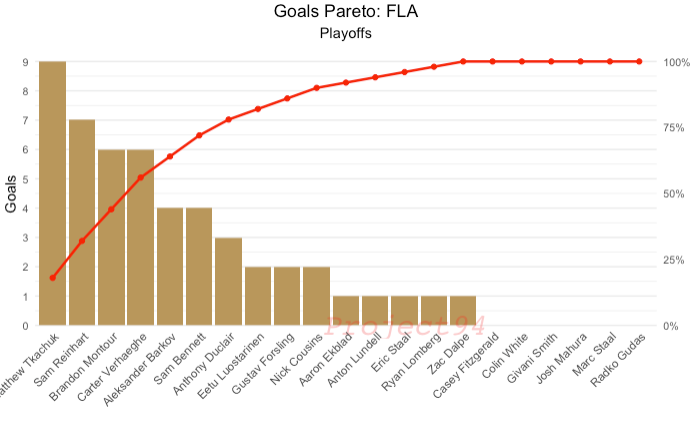
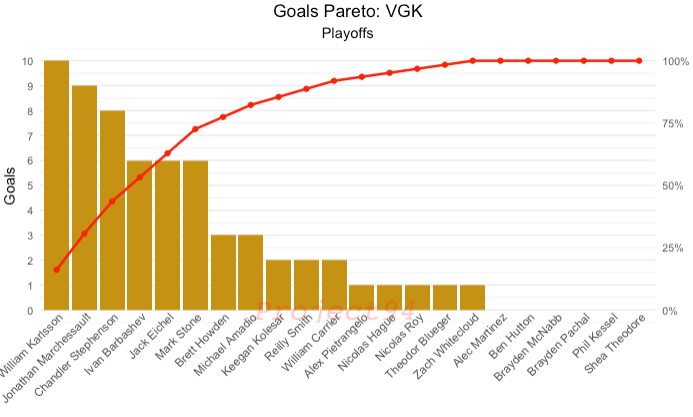
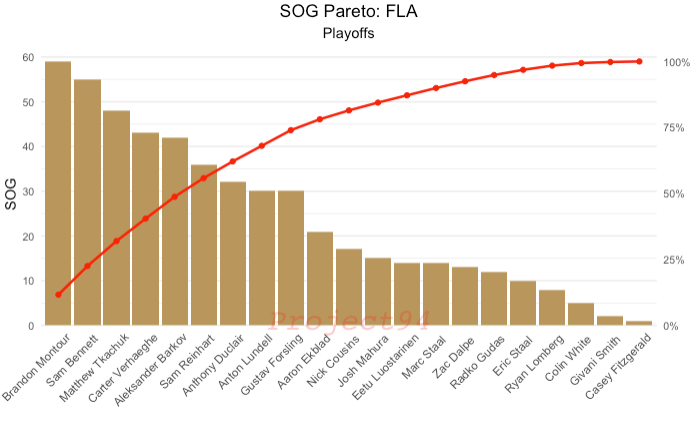
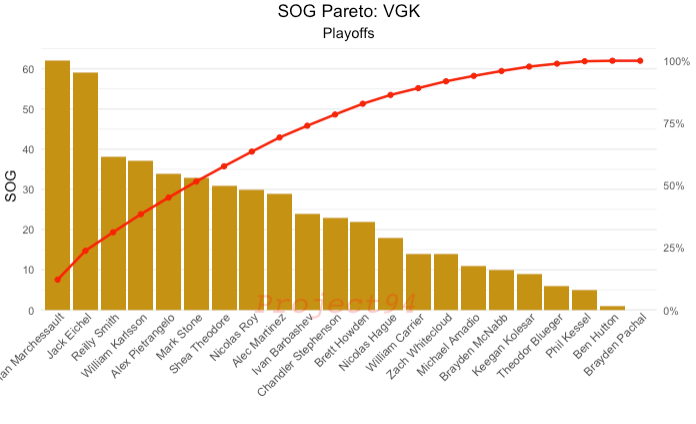
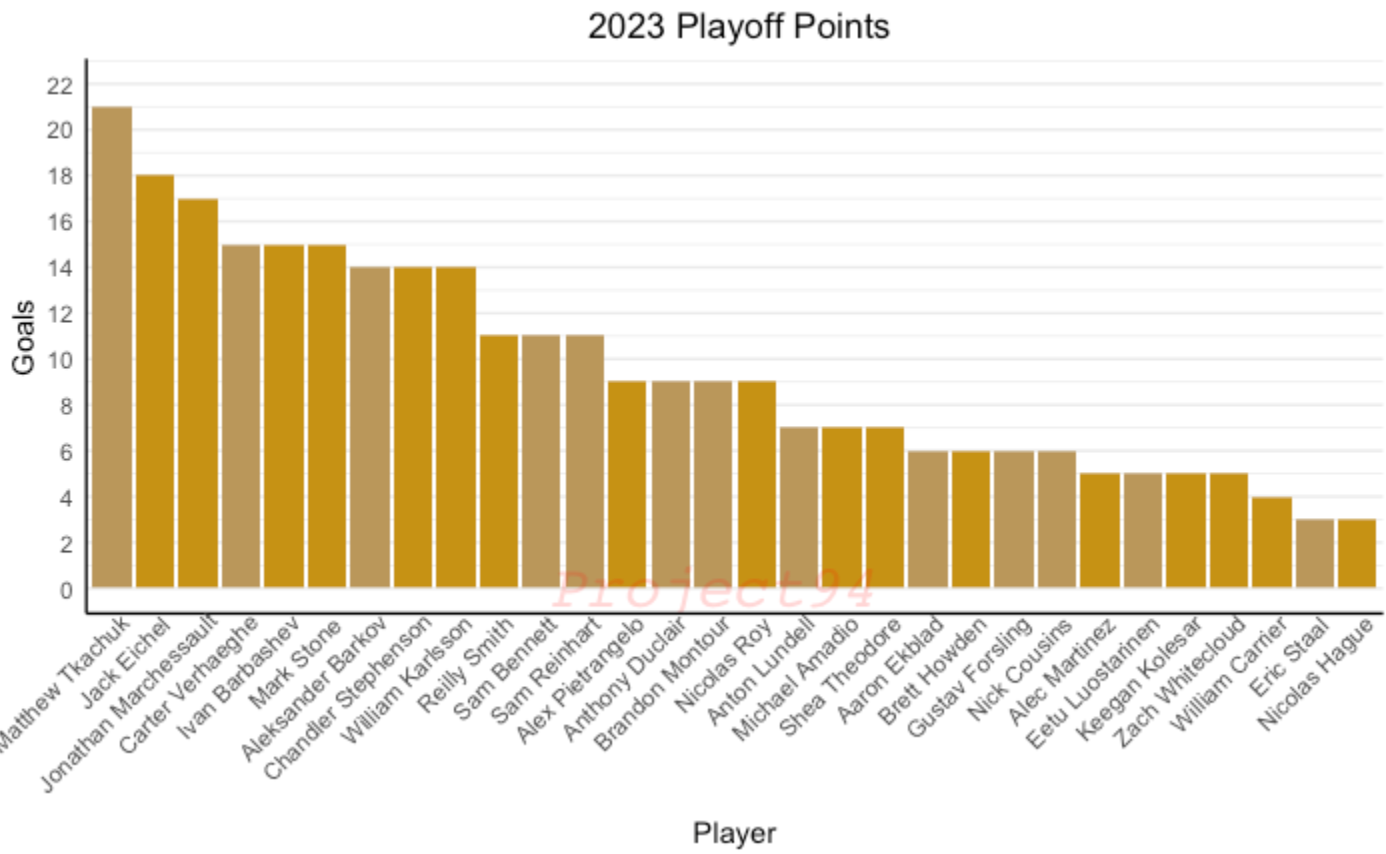
While both teams have incredible depth in their lineup, it's not apparent that one team is "deeper" than the other. An interesting view of such an analysis would be a pareto analysis. That is, how many players score 80% of their goals (or generate another metric)? The larger the player count, the "deeper" the team.
For Florida, 80% of their playoff goals came from 7 players and 80% of SOG from 10 players. For Vegas, 80% of their playoff goals also came from 7 players and 80% of SOG from 11 players. For context, the "deepest" team according to such an analysis would be Seattle, with 10 players contributing to 80% of their goals scored in the playoffs. It's harder to compare in the regular season as Montreal led the league with 15 players contributing to 80% of their goals.That being said, the Golden Knights had 12 players score 80% of their goals to the Panthers' 10 players.
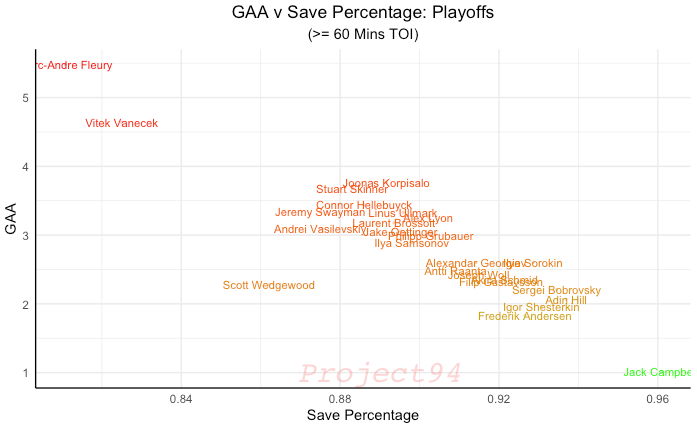
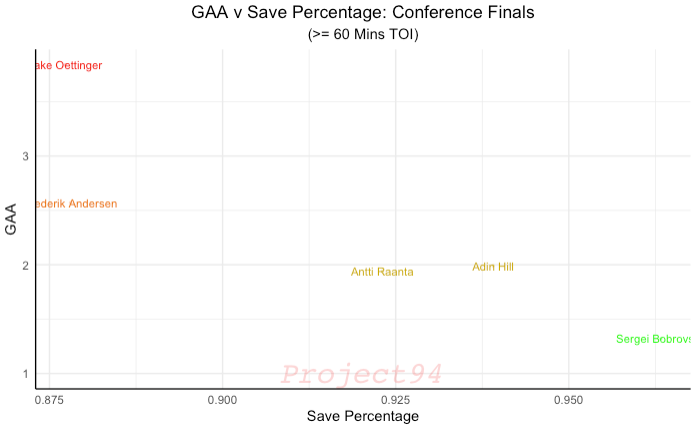
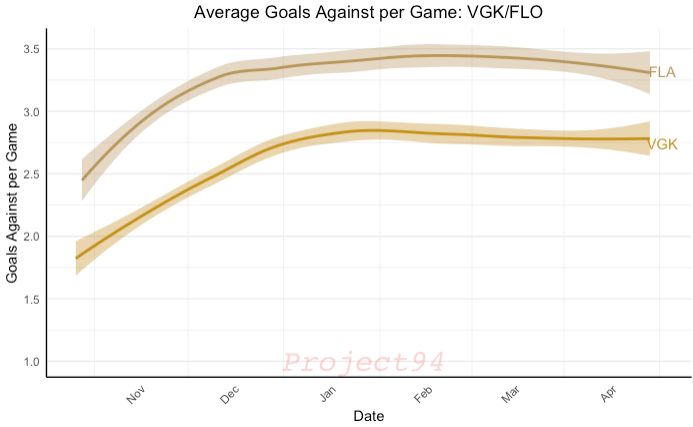
After the first round, Sergei Bobrovsky has stepped up his game to another level, one we have not seen in years. It's been 2-time Vezina winner Sergei Bobrovsky, posting a 1.12 GAA on 174 SOG in the Eastern Conference Finals. Florida's SOG Against per Game was also the most of any team in any round of the playoffs so far (43.5), which included a 4OT and a single OT game (a "per 60" metric would help here to level the playing time across teams). The lens should be focused on Bobrovsky's workload and focus as the Panthers have allowed just 2.69 goals per game in the playoffs, a big jump from 3.32 in the regular season.
Vegas has stayed more consistent in goals against per game as they allowed 2.74 in the regular season and 2.64 in the playoffs. Similar to Florida, though, Adin Hill has held strong in net and is a big reason the Knights have made it this far. Coming into the playoffs after play started in Round 2, Hill's GAA was 2.19 in that round and 1.99 in the Western Conference Finals. Though facing fewer total shots in the playoffs, Hill's .937 Playoff Save % should not be discounted.
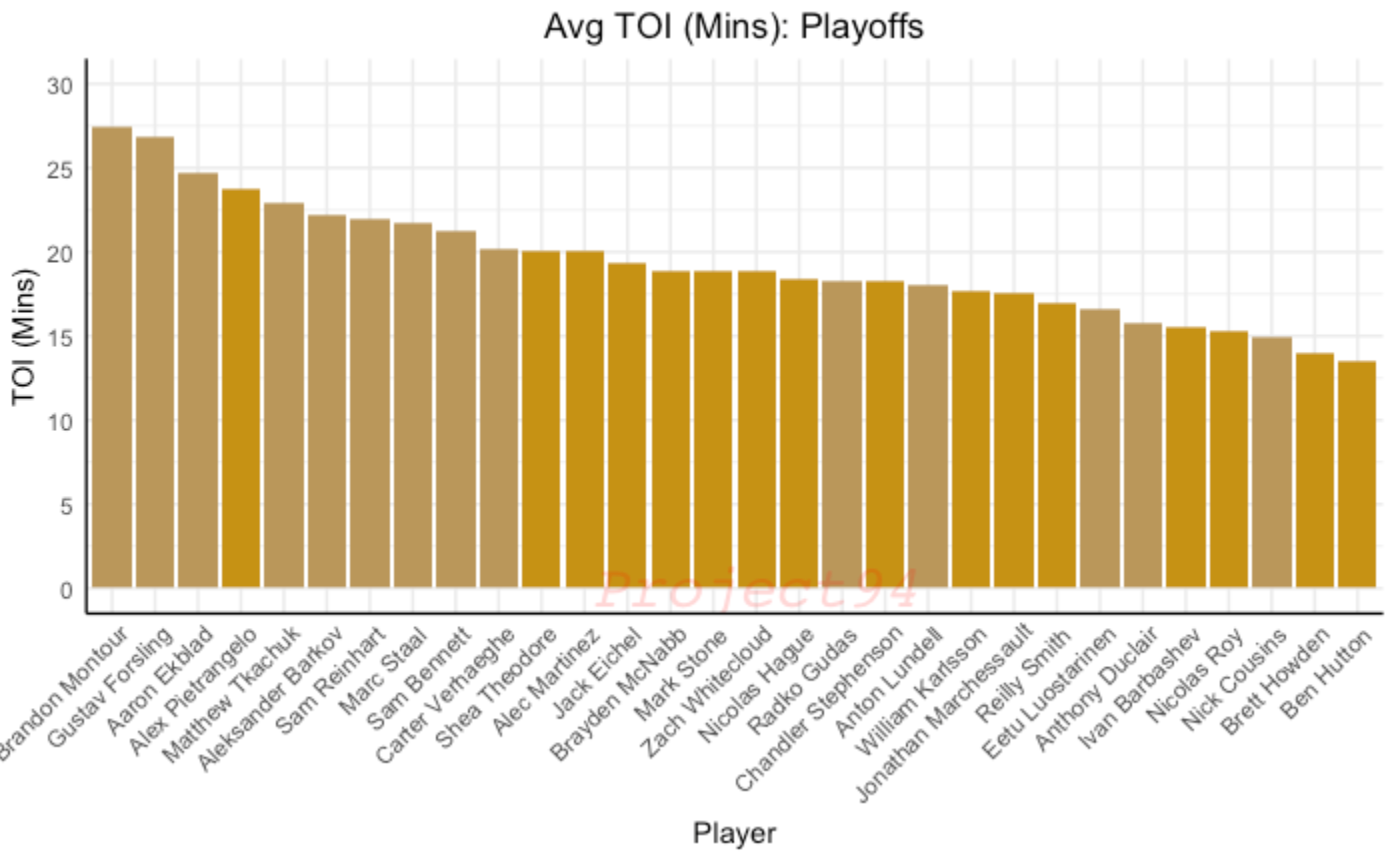
Another talking point ahead of the Finals has been the rest between games for the Florida Panthers, though both teams are getting multiple days. Panthers players, mostly due to overtimes, have averaged more TOI per game. This is possibly offset by the rest between the Conference Finals and Playoffs, but even so, the offensive production is equitable between each time regarding lines and depth, as the pareto analysis displays. TOI fatigue is probably not a major factor in this game with the rest and production from each side.
Key Factors for Prediction
Defense and Goaltending:
With all this being said, the goaltending is hard to look past in the Panthers net. While the Panthers allow more SOG per Game (both regular season and playoffs), Vegas generates much fewer SOG per Game, which is a point Florida's favor with Bobrosvky.
Offensive Production:
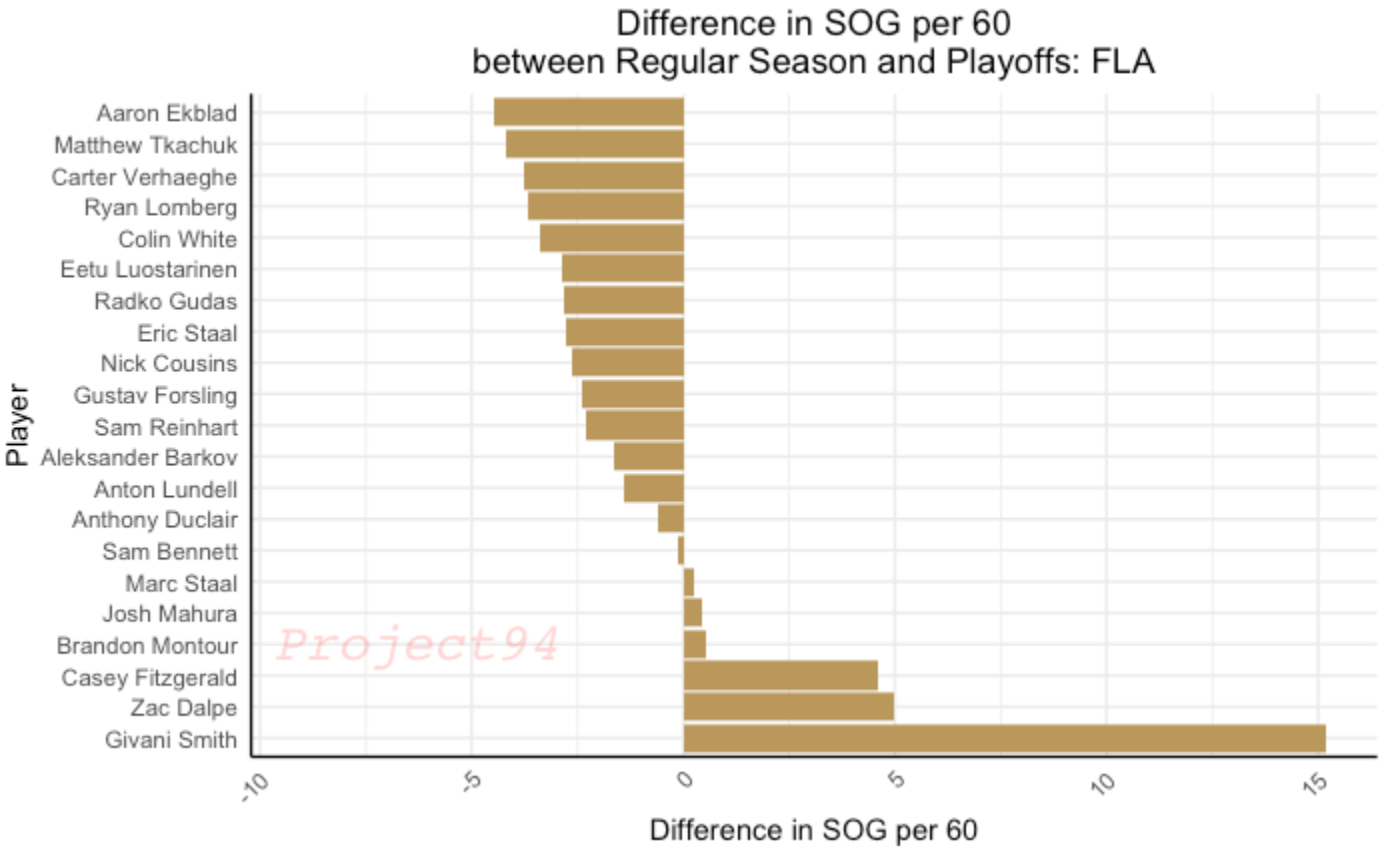
While the Panthers generate more shots and goals per game, their individual shooting rates have gone down in the postseason due to their opponents being more defensively focused (i.e. Carolina and Boston). Because the Golden Knights allow more shots and Florida was able to outshoot them in both regualr season matchups, I look less into the decreasing shots per 60 for the Panthers and more into their ability to score as a collective.
Record Breakdown:
Florida's road record this postseason is 8-1-0, and the Panthers are undefeated in overtime. Though Vegas' 6-1-1 is nothing to scoff at, an impressive road and overtime record leans in favor of Florida
Players to Watch
| Player | Team | Games Played | Goals | Assists | Points | SOG per 60 | Avg TOI (Mins) |
|---|---|---|---|---|---|---|---|
| Jonathan Marchessault | VGK | 17 | 9 | 8 | 17 | 12.5 | 17.5 |
| Jack Eichel | VGK | 17 | 6 | 12 | 18 | 10.8 | 19.3 |
| Matthew Tkachuk | FLA | 16 | 9 | 12 | 21 | 7.9 | 22.9 |
| Anthony Duclair | FLA | 15 | 3 | 6 | 9 | 8.1 | 15.8 |