Right from the Jump: Analyzing Players Off to a Hot Start Around the League
A previous edition of this article excluded giveaways and takeaways from the Net Offensive Rating Calculation - this has been revised in the version below to reflect the difference between the NOC calculation and Corsi
As the season is roughly 10% complete and players are already showing their determination to win this year, it's time to take a closer look at which players are off to the strongest start both on the stats leaderboard and in numbers reflecting their general play. Per 60 metrics are strong indicators of how effective players are with their ice time, but it is also important to analyze the types of plays that are happening while players are on the ice.
General League Leaders
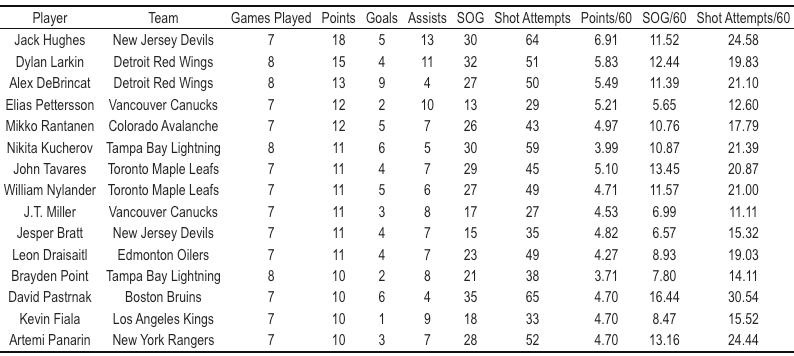
It's remarkable the start Jack Hughes, Dylan Larkin and Alex DeBrincat are off to this season. They each have recorded a point in all games played, and have a total of 18 points, 15 points, and 13 points, respectively. With 64 shot attempts in all situations, Hughes has posted 24.58 Shot Attempts/60, which is well higher than the mean of players averageing at least 15 minutes of ice time per game (10.22 Shot Attempts/60). The DeBrincat/Larkin production for the Red Wings has been equally impressive. They've connected on 7 goals in 8 games played, have shot 59 pucks on Goal (in all situations), and individually have been on the ice for 20 goals and 18 goals (DeBrincat and Larkin, respectively). It is no mystery why the Red Wings lead the league with 35 Goals For and 5th in SOG (250).
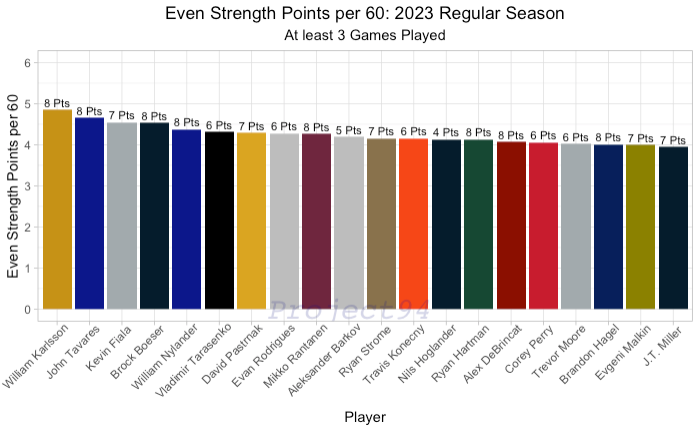
Even Strength Points per 60
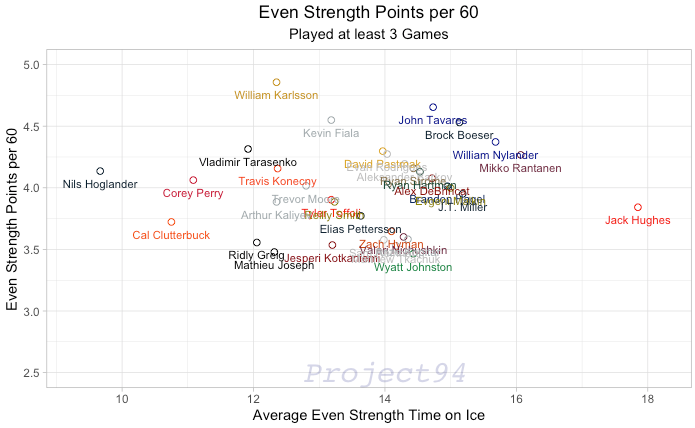
Looking closely at even strength play, we can see a different picture of players. In the chart above reflecting Even Strength Points per 60 leaders (who have played at least 3 games), William Karlsson, John Tavares and Kevin Fiala fall at the top of the list. Karlsson has been particularly impressive with 2 goals and 6 assists, for a Points per 60 of 4.86. Karlsson has averaged just 12.35 Even Strength minutes this season, which amongst this top 20 group for Even Strength Points per 60, is the 4th fewest minutes. The chart below reflects the Points per 60 metric as a function of their Time on Ice, and therefore can be used as a better measure of who is 'taking advantage' of their ice time the most.
On Ice Events
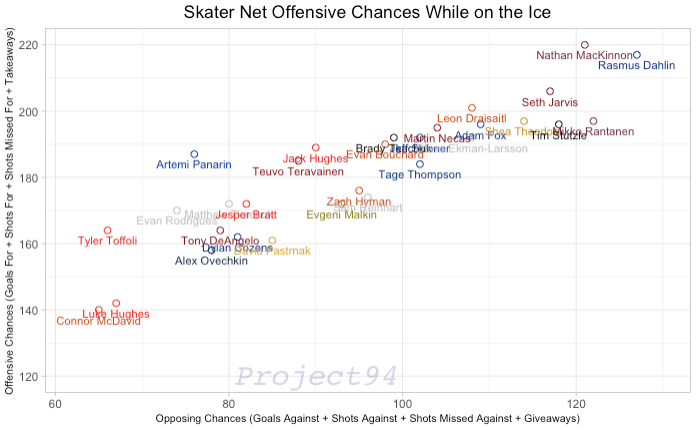
Though scoring is an obvious indicator of a player's performance, it may not reflect what the player is doing off the puck or how they are contributing to getting their team offensive chances. For this lens, counts of on-ice events for each player will paint a better picture, similar to the Larkin/DeBrincat observation above. We've calculated 'Net Offensive Chances', or NOC, for each player as the following events while they're on the ice (including those for which they are attributed):
Net Offensive Chances = (Goals For + Shots Saved + Shots Missed + Takeaways) - (Goals Against + Shots Saved Against + Shots Missed Against + Giveaways)
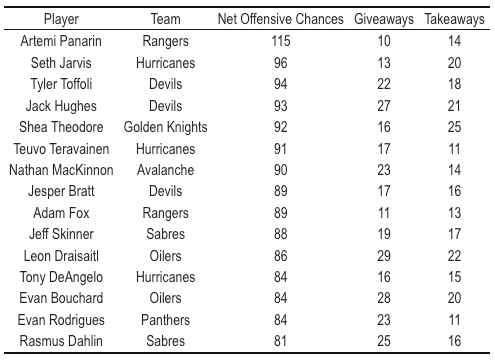
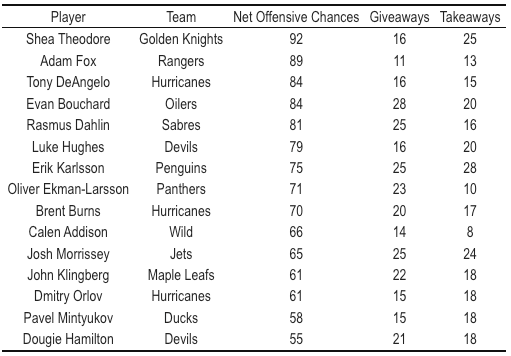
Artemi Panarin, who is off to a strong start playing with Filip Chytil and Alexis Lafreniere, is leading the league with a NOC of 115 and has 10 points (3G/7A) in 7 games played. Similarly, Evan Bouchard is a leader for defensemen in this category and is 13th amongst all skaters, which is remarkable considering the first line matchups and 20.9 Minutes per Game. The chart below shows a breakdown of the calculation, and whose offensive abilities are making up for chances they are giving up when on the ice.
There is still plenty of season left, and there are many players who have yet to show their final impact on their teams' success. While competitive trophy races like the Hart and Rocket Richard trophy force every player to make the most of every game, it is fair to say we have yet to see the most out of players' ability to impress and score.