Points per 60 in Perspective
Breaking down Points per 60 and how metrics like these should be analyzed and interpreted given their statistical distributions.
Points per 60 is used often to measure a player's direct scoring impact based on their time on ice. A metric like this is helpful when comparing players that do not get as much time on ice as others, and therefore we can give an equal baseline to all players and pose "If all players were given 60 minutes of ice time, they would score X points." Points per 60 for a given player is calculated by the following equation:
Points per 60 = (Total Points/Time on Ice (Mins))*60
But what is a good Points/60 when analyzing postgame data? How does a metric like this change over the course of a season and are they are effectively comparing players? Taking a closer look at 2022 and 2023 game statistics will explain some of the pros and cons of Points/60.
2022 Top Performers
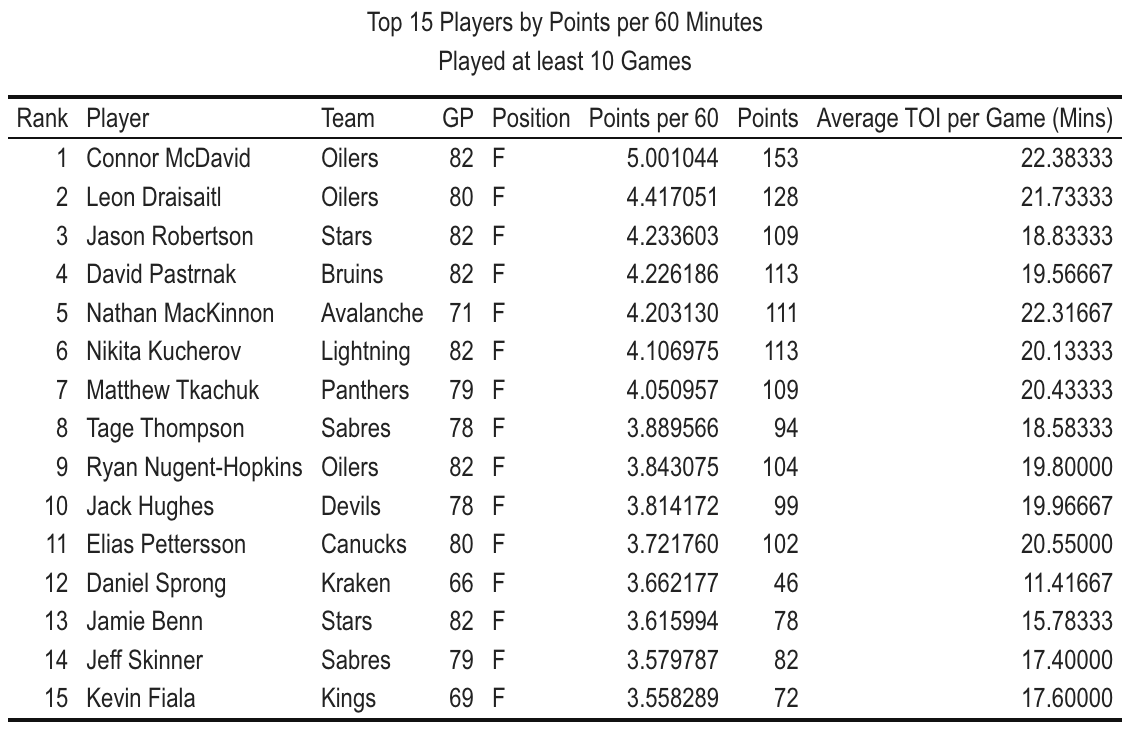
Connor McDavid and other top scorers led the league in Points per 60 amongst players who played at least 10 games. The median value within this group is 3.89 Points/60, ranging from 3.56 up to 5.00, which even within this sample is quite high. Two key observations here are that every player is a Forward and then the Average TOI is 19.1 Minutes per Game, the lowest being Daniel Sprong in Seattle with 11.42 Minutes. Foreshadowing for this article is that his numbers remain high with increased TOI in Detroit this season.
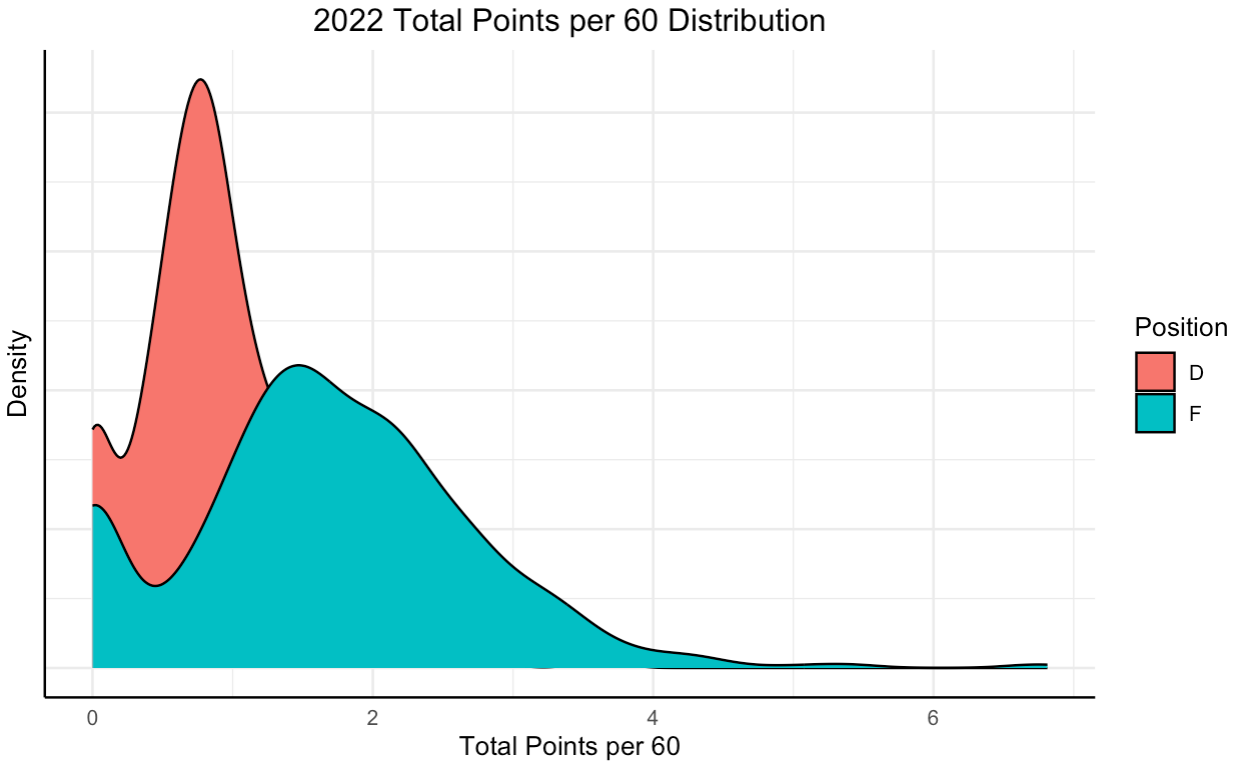
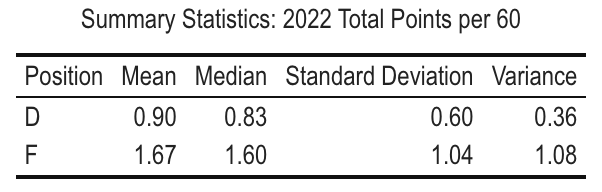
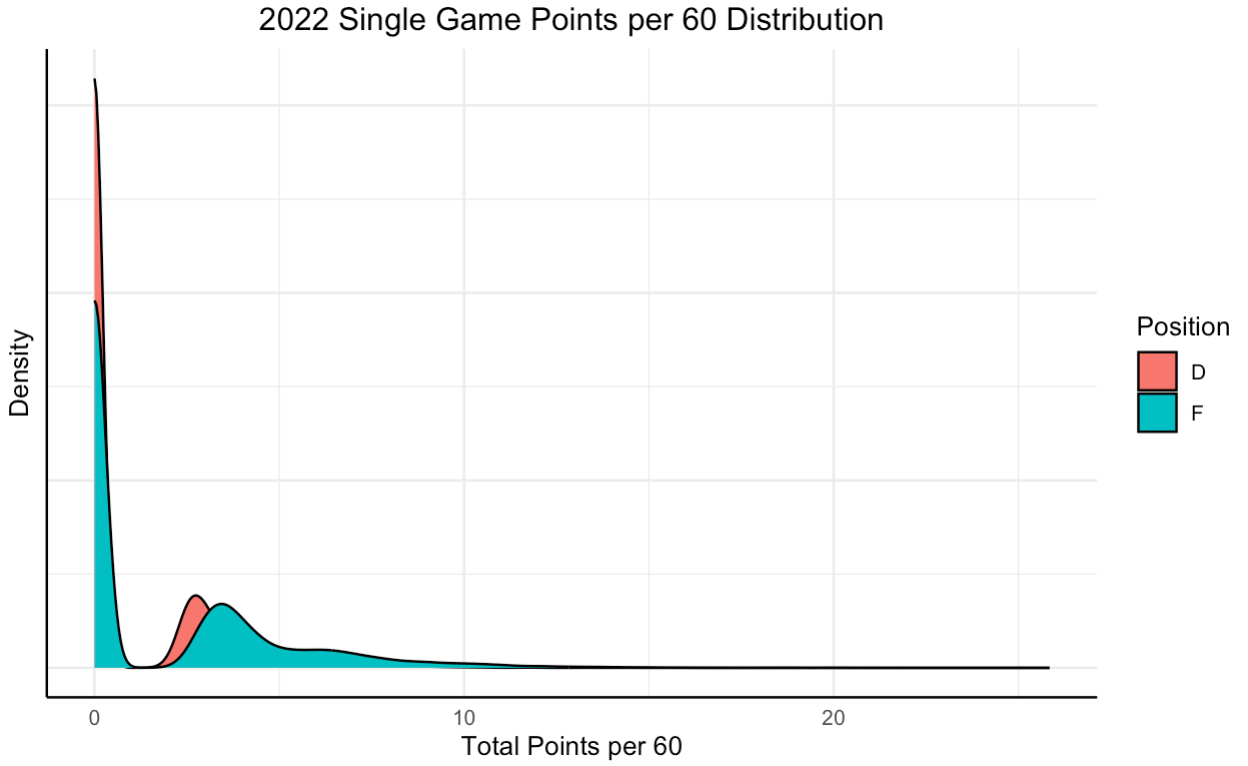
Looking outside this group to the league, the statistics change quite a bit. Looking at defensemen and forward, the league average is 1.67 Points per 60 for forwards and 0.90 for defensemen. The standard deviation, measuring variability in the metric amongst players, is extremely high with 1.04 for forwards and 0.60 for defensemen. Based on the density plot below which shows the distribution of the Points per 60 values in 2022, a large portion of the league finished the season below 1, which already gives context that an above average or above median value can be interpreted as a high performer.
Game by Game Analysis
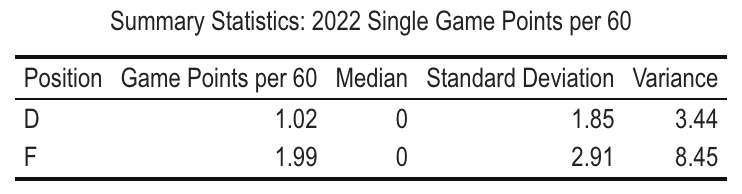
Values at the end of each game are a bit different. They vary a lot more because of the high probability of getting 0 points for 20 minutes of ice time. On the other end, if a player has a great night, with let's say 3 points in 18 mintues, their Points per 60 would be 10 Points/60, well above the league season average. This means that game by game deviation is going to be quite high, with the median (50th percentile) still at 0 Points/60.
A game's "per 60" metrics can still be useful within a "single game" context as they can help show who was most efficient on the ice, specifically with points. That being said, with Points/60 being so reliant on showing up on the stats sheet, more efficiency based statistics like Unblocked Shot Attempts or Corsi that attempt to catch more plays other than scoring plays can help understand on-ice efficiency.
Points per 60 Change Throughout the Season
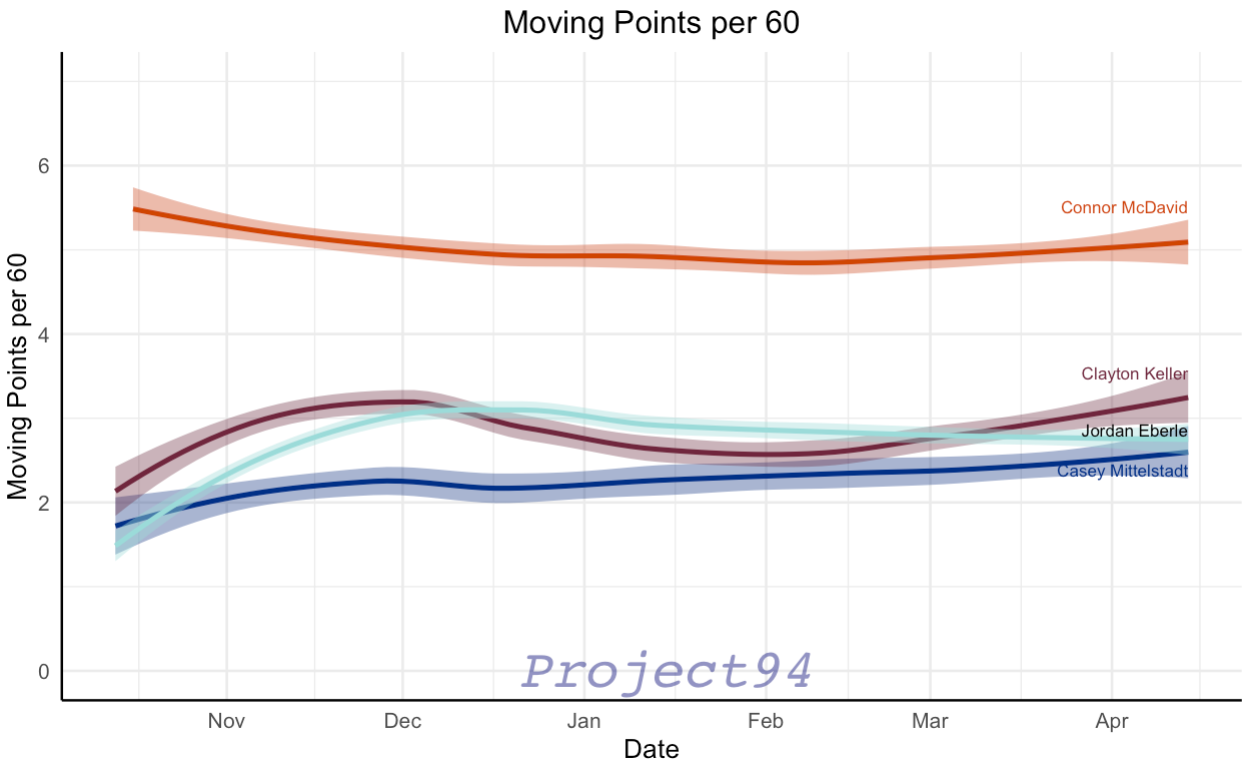
Calculating a "running" points per 60 consists of consistently adding points totals and total time on ice to recalculate the player's season long Points/60 after every game. Because game by game variability is so high, interpreting a player's trending Points/60 will help clear some noise in the data and understand if a player is taking more or less advantage of their ice time as it relates to points. A note on this analysis is that if a player's TOI is increasing but their points do not increase at the same rate, their points/60 may drop (and inversely the same change).
Analyzing both trending Points per 60 as well as cross-analyzing their TOI can be helpful in this area. Generally, if a player's Points/60 is increasing, it should reflect an increase in on-ice efficiency in points production. Therefore, isolating Points per 60 trends to within 5-7 games or looking at the season's full picture is effective in player analysis.
2023 Points/60 leaders
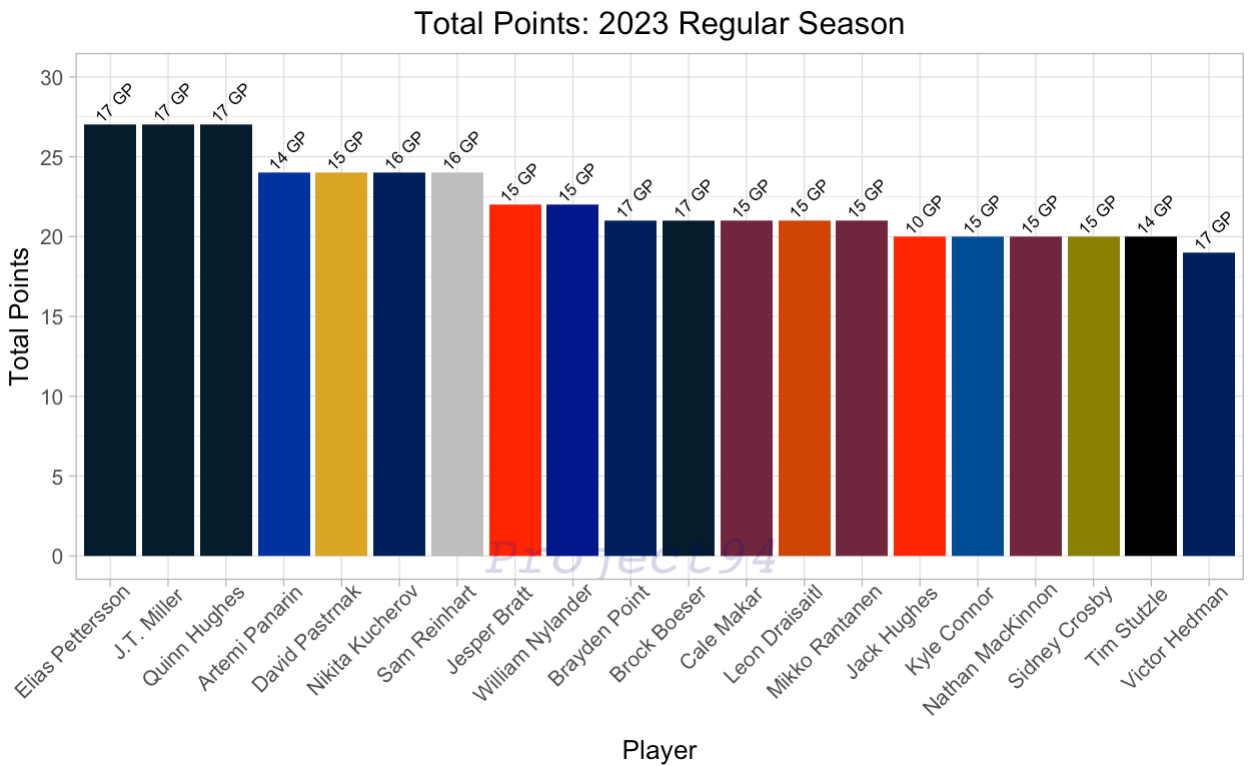
Of course, the list of leaders in Total Points and Total Points/60 overlaps quite heavily; intuitively, the more a player scores, the higher the Points/60 and as seen earlier, there is a heavy cost to getting 0 points for every minute played. High skill talent like Elias Pettersson, Jack Hughes, Artemi Panarin, and David Pastrnak are at the top of both lists as expected.
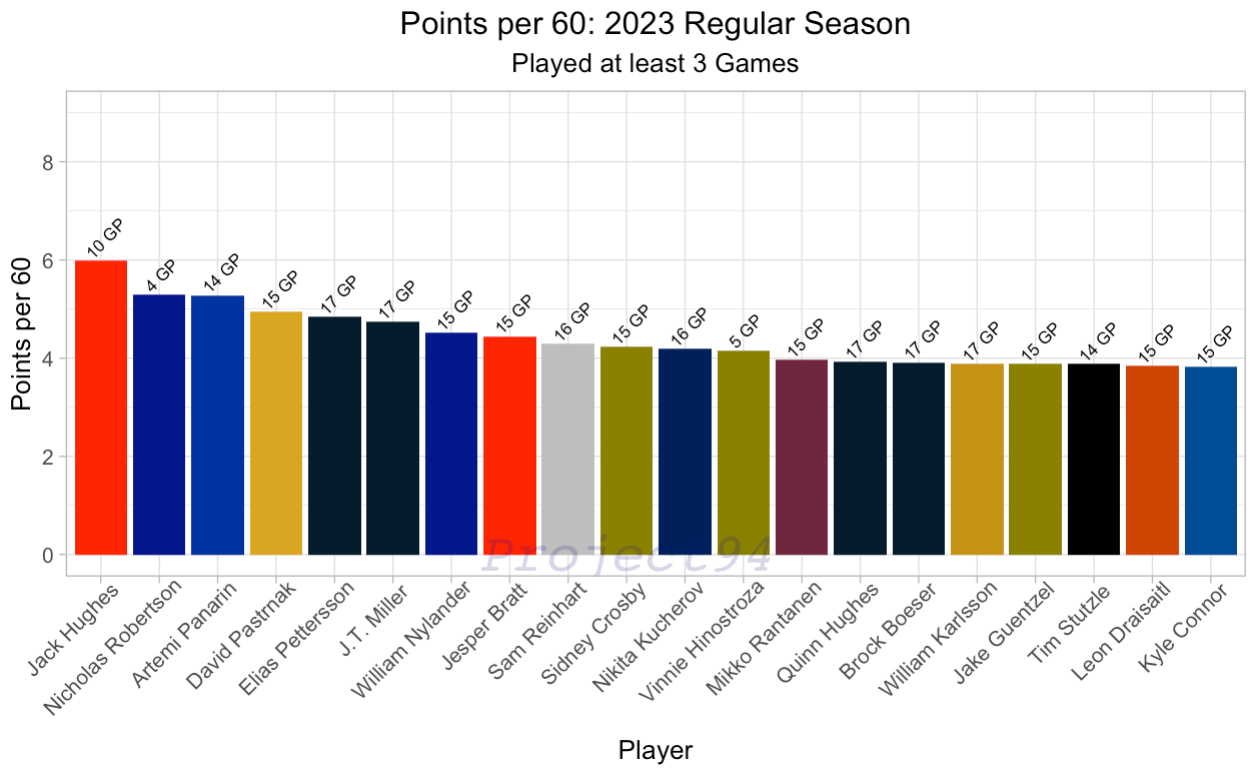
The goal of this metric is to identify players who are more efficient with their TOI than their total points stat appears. But, standard deviations above the mean is difficult to use in this case as the data is heavily skewed, so percentile comparisons are more useful. Below are players (playing at least 3 games) above the 75th percentile in Total Points per 60.
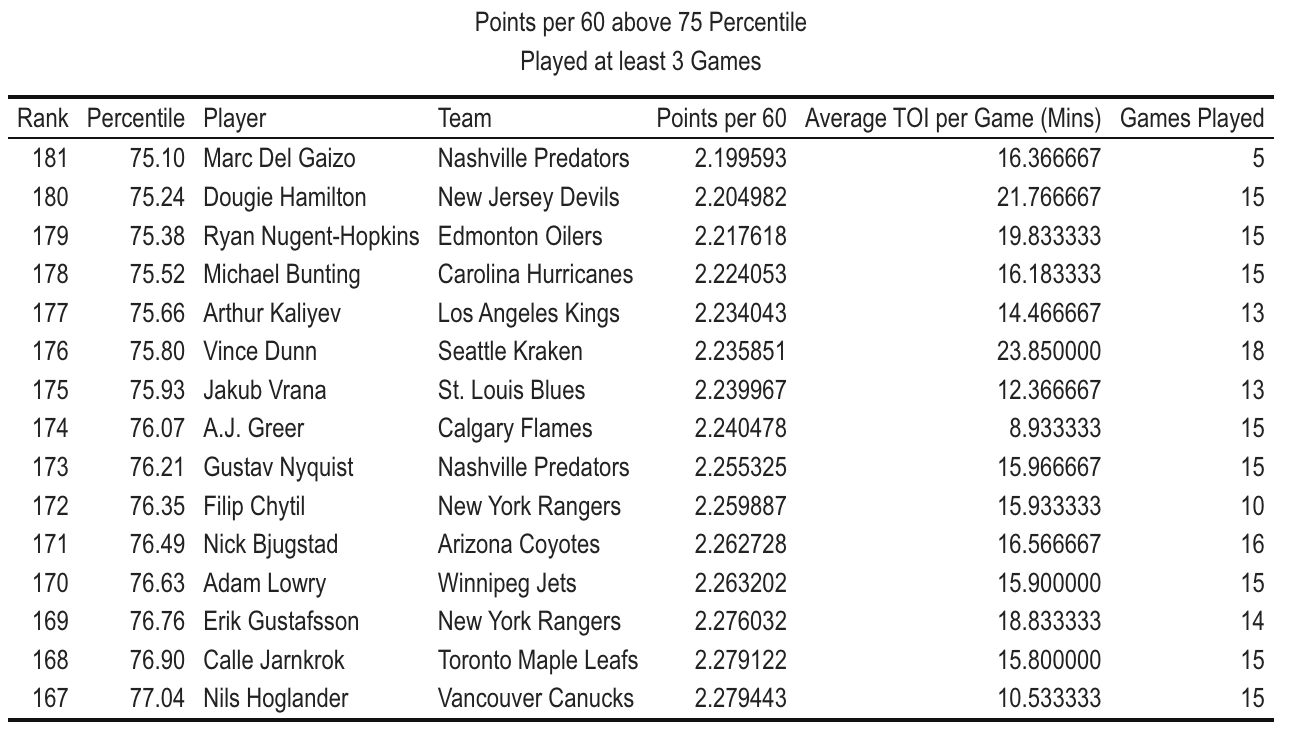
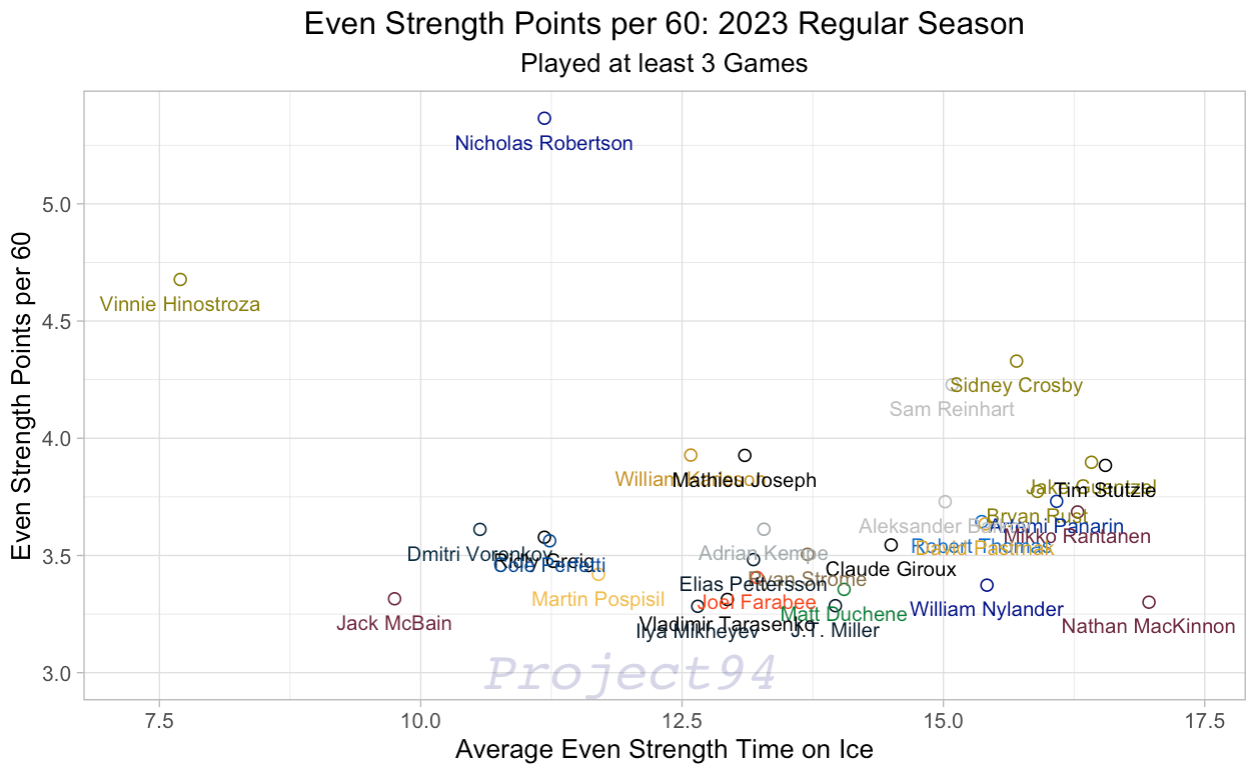
Breaking down Points per 60 between totals and even strength is another helpful tool as Powerplay TOI can inflate overall Points per 60 with low minutes on the ice but higher propensity to score. While the leaders don't necessarily change a ton, names do get shuffled around. For example, Jack McBain's "efficiency" increases in the Even Strength view as his TOI has gone down but increased in Points/60, making him more efficient. In this lens, the goal is to be as close to the upper left corner relative to your TOI total.

While there are 181 players that are above the 75th percentile in Points per 60 (all skaters), this list shows that there are players who could be deserving of more playing time. A good example is Erik Gustafsson of the New York Rangers, who has really proved to be a valuable piece of the defensive core after signing as a free agent this summer. Points per 60 is a useful metric that can help contextualize efficiency on the ice. Continuing development in "per TOI" metrics will further help identify key players that may not be at the top of all leaderboards.