Do More Shots Lead to More Wins?
In our daily newsletter, the 94 Morning Report, we consistently produce analyses and include charts that recap the shot differentials from every game. However, there are a lot of questions around how much the shots on goal from each game actually tell the full story of how a game is being played. For example, a team could be outplayed in a given period or the full game but have more shots on goal at the end of the game. That being said, hockey is a results-driven game. So, do more shots on goal or more shot attempts mean more wins?
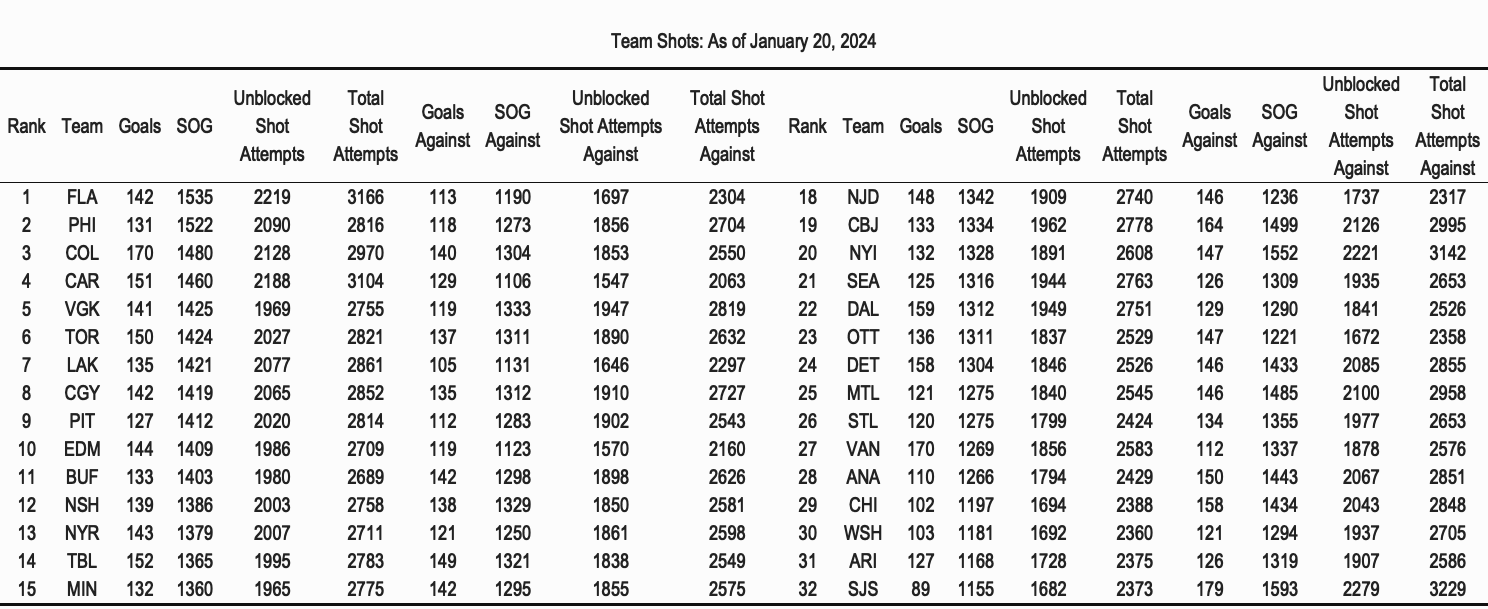
It's no suprise the leaders in Shots on Goal are high-performing teams like the Flyers, Panthers, Avalanche and Hurricanes. Though they lead the league, it doesn't always mean they 'outshoout' their opponents. In all games played this season so far, the team that has more Shots on Goal has won 52.5%, and the team that has more Total Shot Attempts has won 54.1%. That is not an overwhelming percentage, and indicates that you don't have to outshoot your opponent to win.
Shots and Team Win Percentage
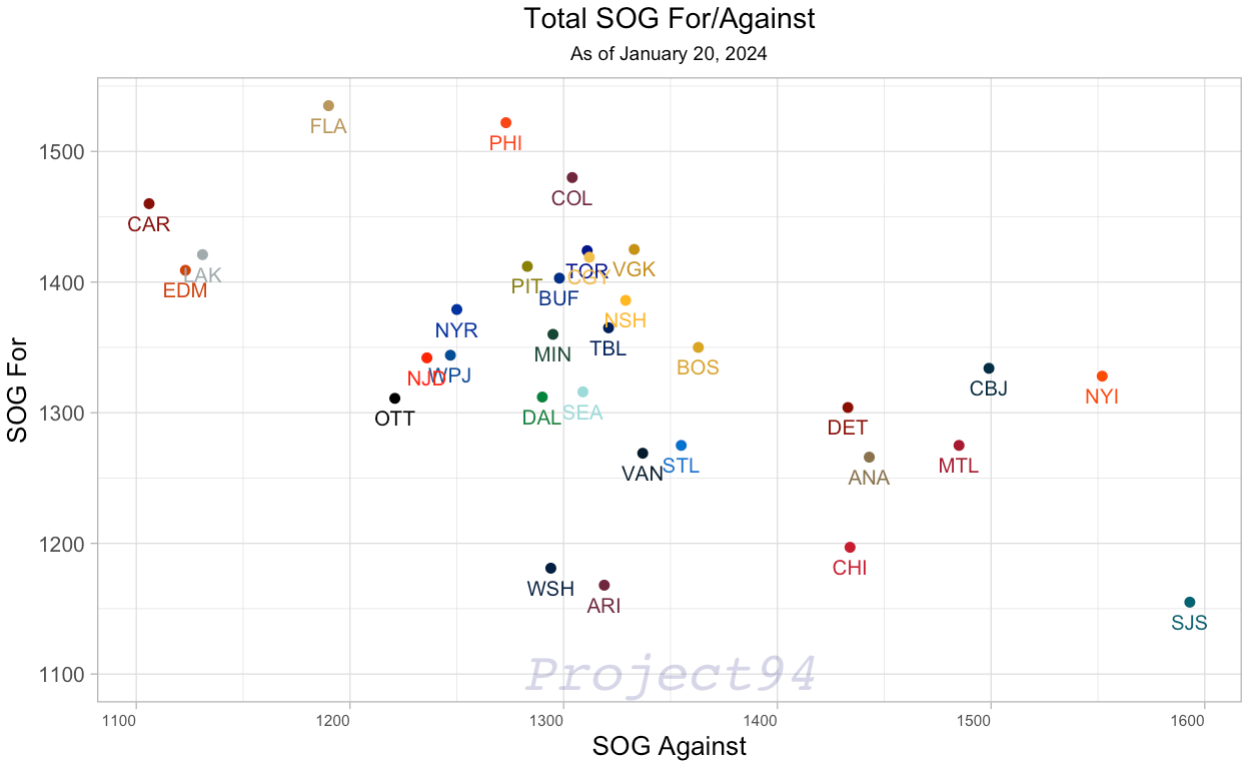
The correlation between teams that shoot more, at a macro level, and teams that are successful is evident. The top 7 teams in SOG (see table above) are in playoff position. Logically, this makes sense as the teams that are successful play-by-play will generate more chances. In the charts below, teams like Carolina, Florida and Los Angeles consistently generate shots on goal with fewer shots on goal against. In this case, the most successful teams are in the top left region of the charts (more SOG for, fewer SOG against).
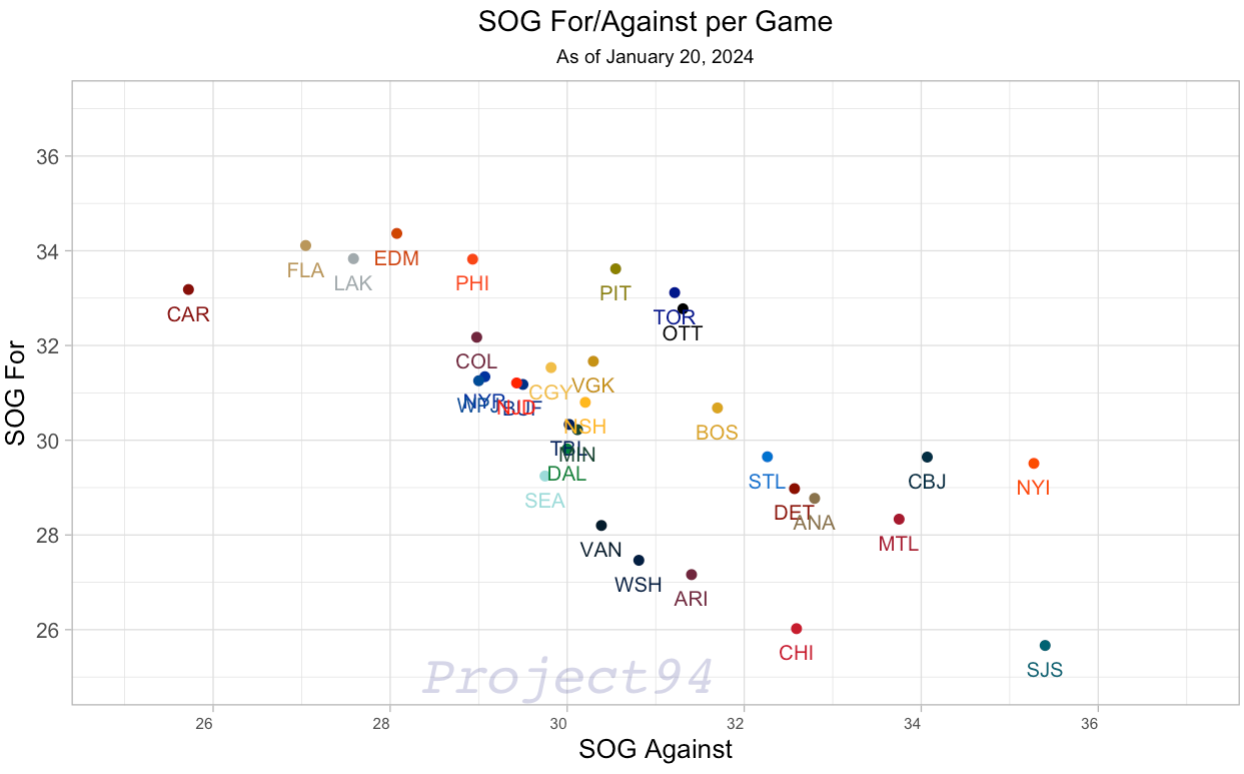
Unfortunately, shots on goal metrics are not always best when comparing team performance. For example, the Colorado Avalanche, albeit still in the top 10 in SOG per Game, have fewer SOG For per Game than Ottawa, who they are outperforming, and more SOG For per Game than Winnipeg and Vancouver, who are ahead of them in points. To this end, it's worth comparing SOG, Unblocked Shot Attempts, and Goal Differential to Win Percentages.
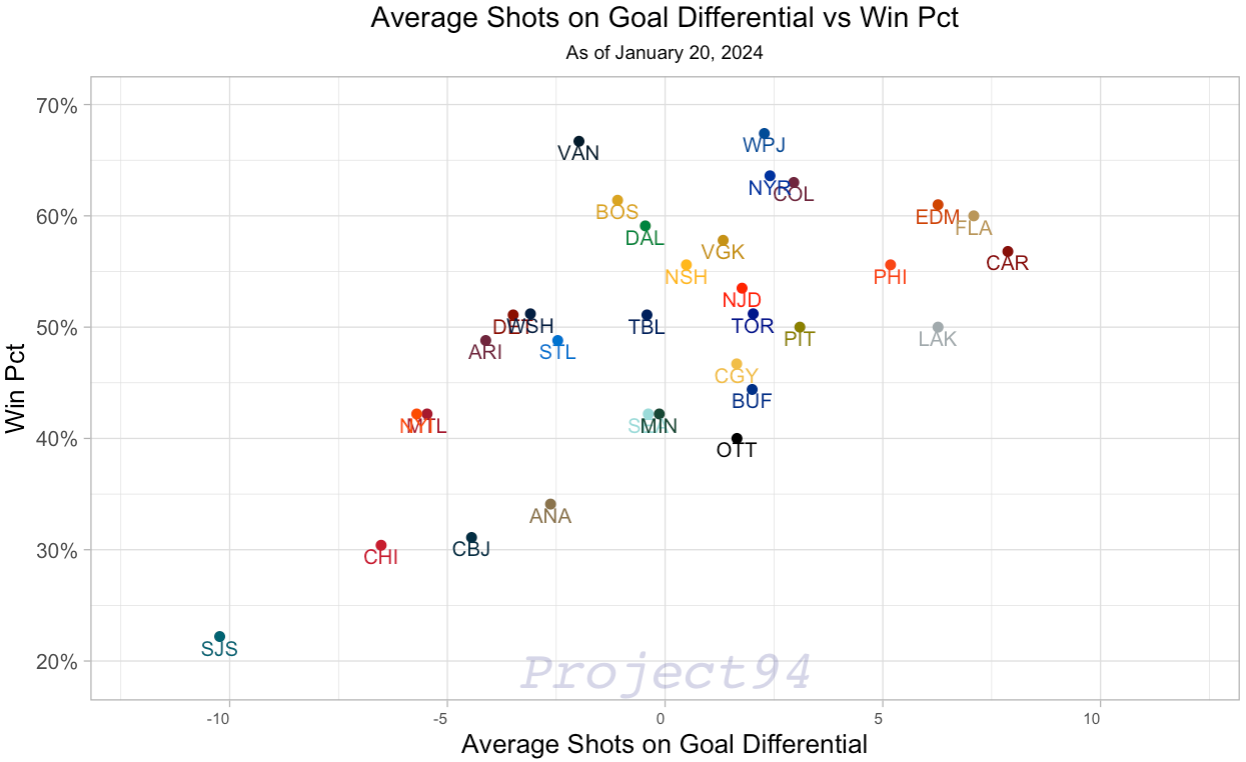
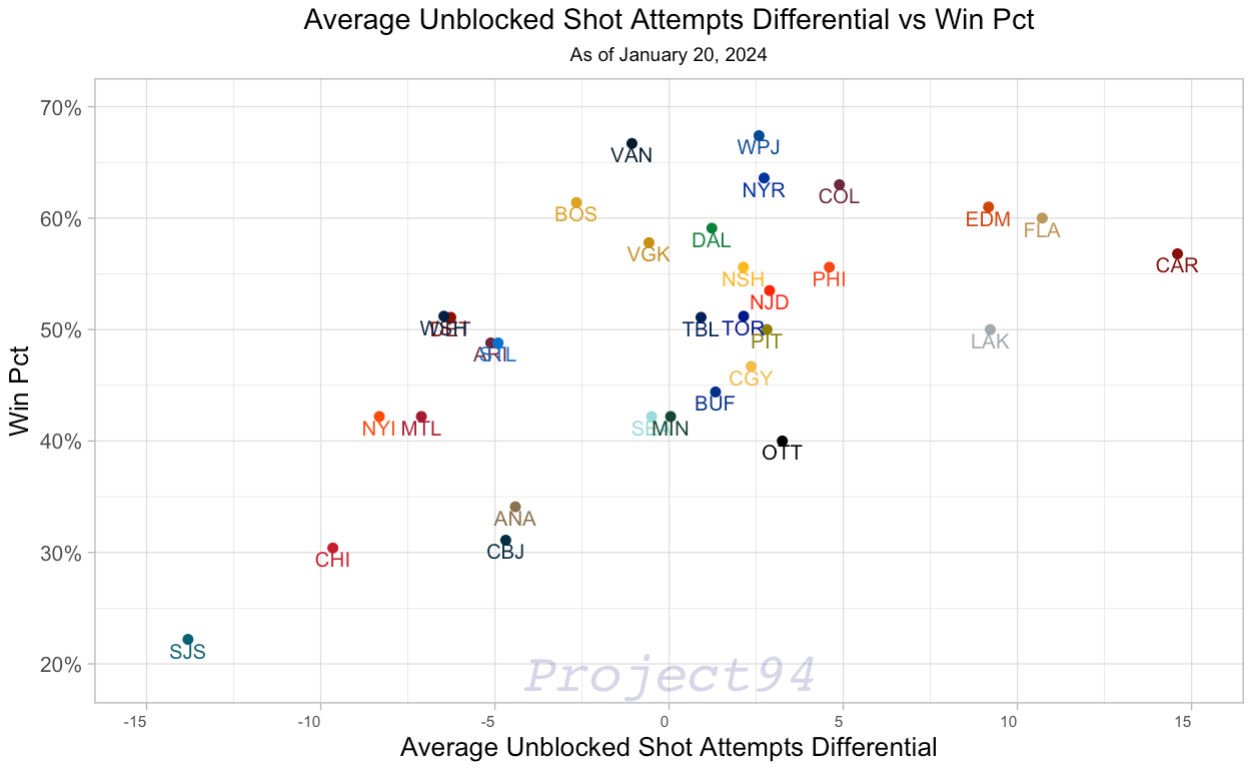
Both charts above show a clear correlation between a positive average SOG differential and overall Win Percentage. However, a high differential does not necessarily mean the highest win percentage. The Vancouver Canucks, who currently have the most points in the NHL, have a negative average SOG differential. The Carolina Hurricanes have the highest average SOG and Unblocked Shot Attempts Differential but sit outside the top 5 for Win Percentage.
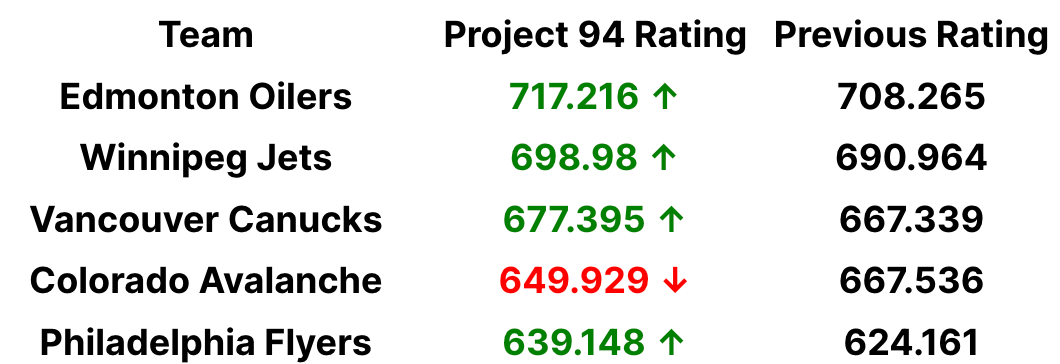
It is hard to decipher if this means teams are underrated or outplaying their capabilities. In our power rankings, the Jets sit at #2 and Canucks sit at #3. Because most teams that have a high Average SOG Differential are high performing teams, it could suggest that the Canucks should improve this metric for more sustainable success.
Shot Selection
Another aspect to consider is shot selection. We are currently working on a Shot Quality model at Project 94, but in the meantime, we will use Percent of Shot Attempts on Goal as a gauge for shot selection. High performing teams will have a high percentage of shot attempts on goal (or percentage of shot attempts unblocked) and lower overall shot attempts if they are shooting less to wait for high quality chances.
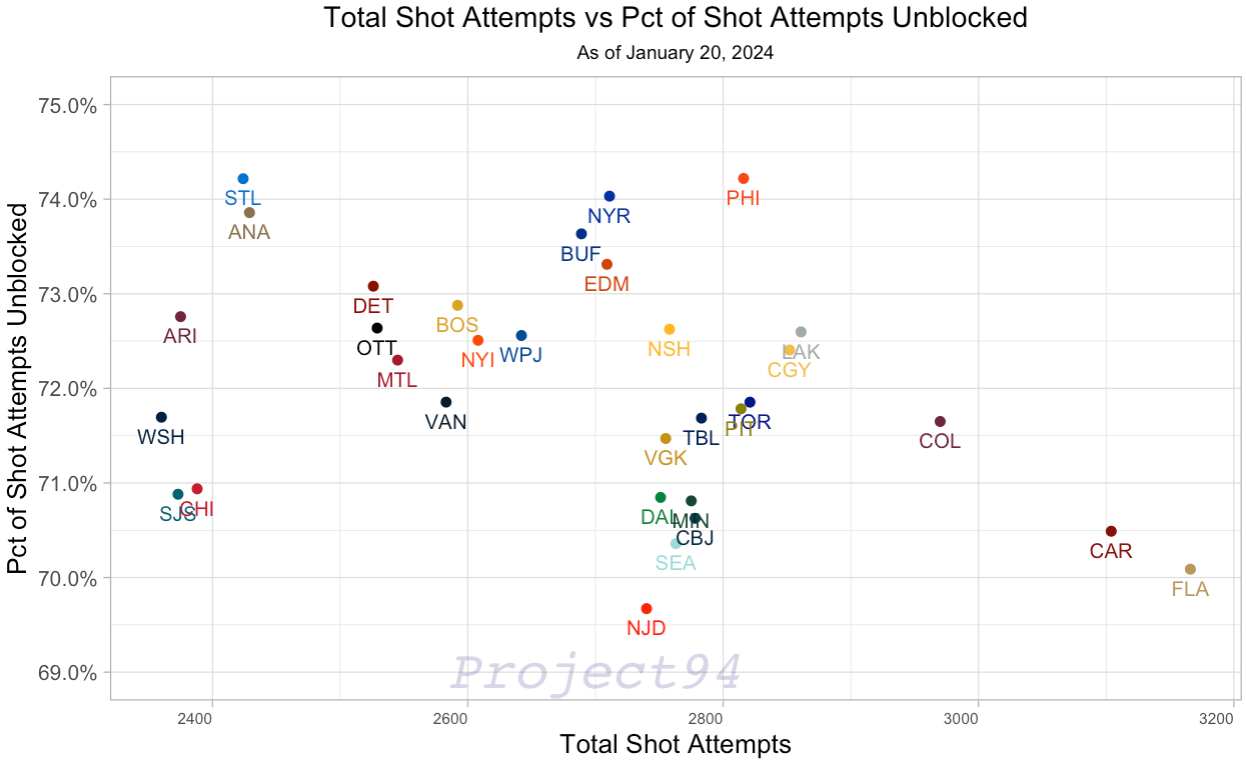
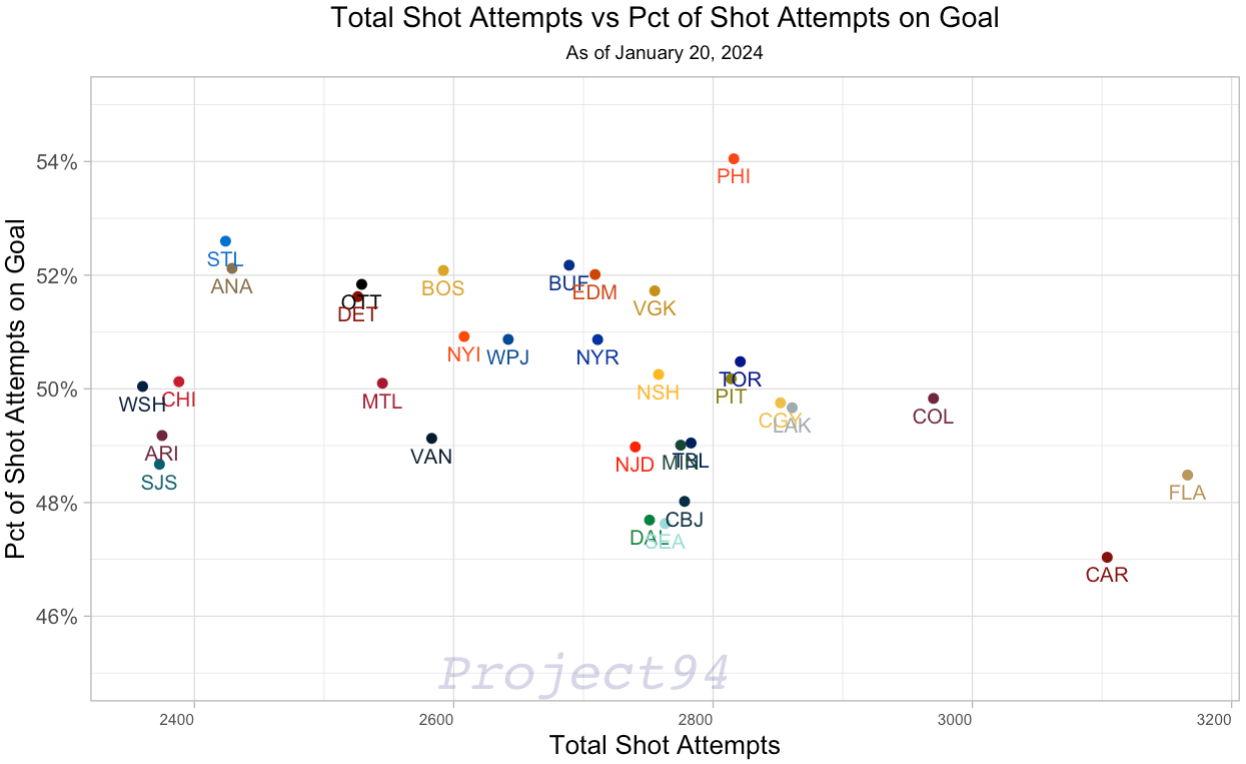
The Philadelphia Flyers, a team that has been on a consistent rise in the last month, have the highest percentage of shot attempts on goal and percentage of shot attempts unblocked, and they are 7th in the total shot attempts.
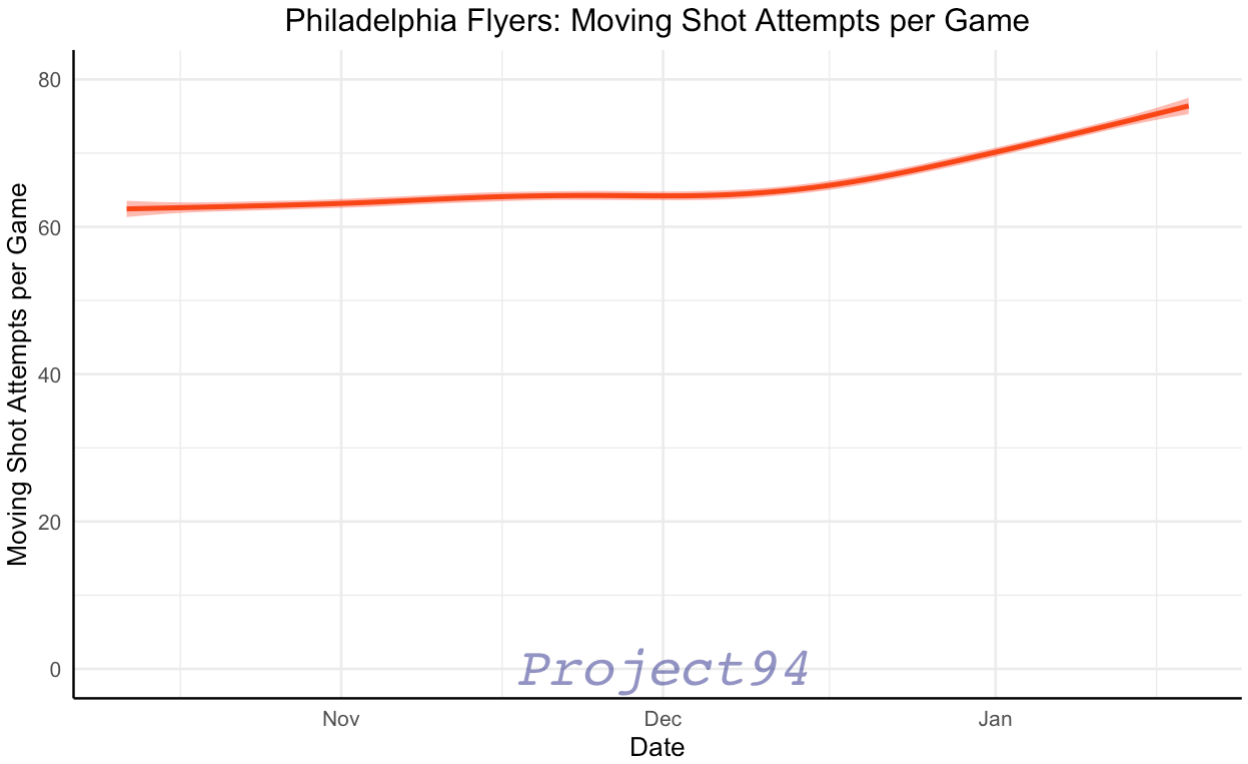
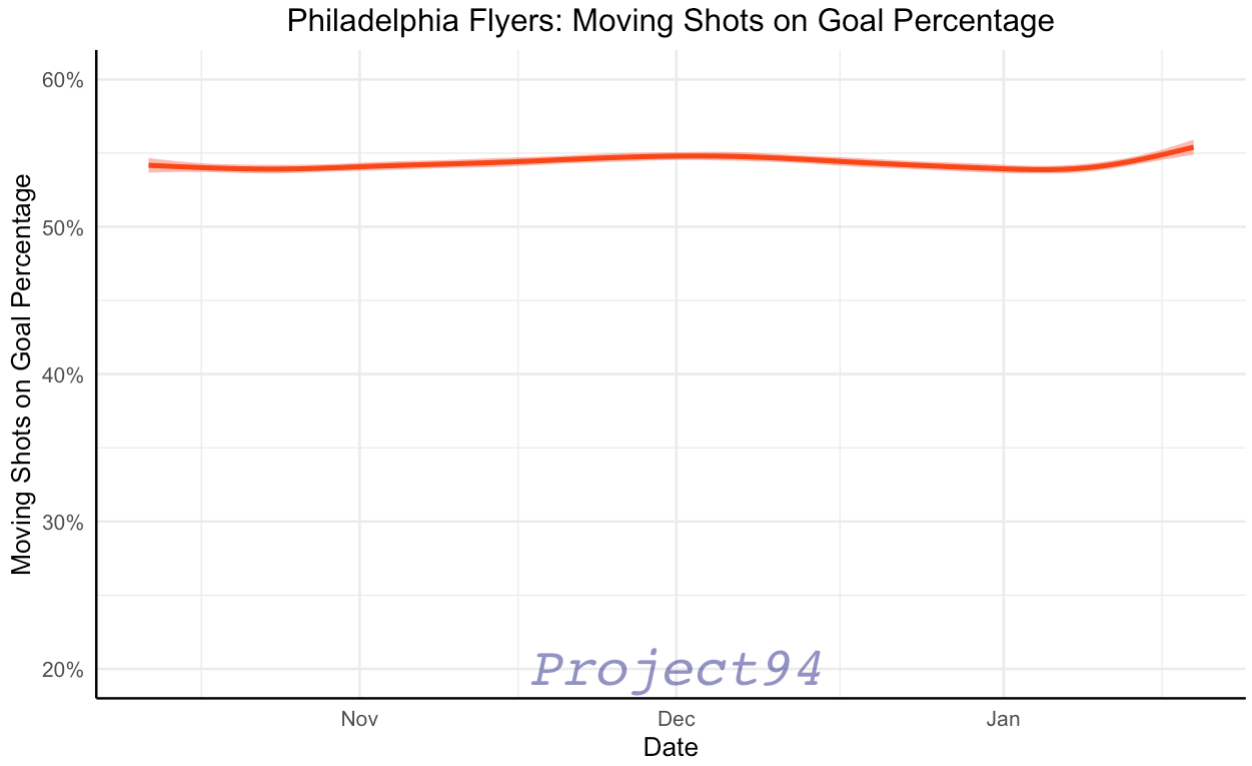
Based on their Moving Shot Attempts per Game, the Flyers are shooting more without decreasing their Shots on Goal Percentage, indicating their recent success, whether caused by more shot attempts or causing more shot attempts, does not mean they needed more of their shot attempts on goal. Because they do not try to shoot as much compared to the Hurricanes or the Panthers but get more on goal, the Flyers could be, purposefully, holding out attempts to wait for optimal quality shots.
While not every game will have a clear winner and loser based on the shot totals, teams on an aggregated level tend to outperform the league with more shots and shot attempts. With the rise of the Flyers and their shot attempts continue to increase game by game, the next month will be extremely interesting if they continue to perform without sacrificing their Shots on Goal Percent.