A major upset in New Jersey gives the Sharks their 6th win of the season, plus win probabilities are set for a full schedule of 13 games today around the league.
Latest stats and analytics updates from games played as of 12/01/23
Results from December 1st, 2023
Home
Away
Score
Matchup Probability
New Jersey Devils
San Jose Sharks
3:6
70.9% : 29.1%
Columbus Blue Jackets
Ottawa Senators
4:2
40.7% : 59.3%
Last Night Highlights
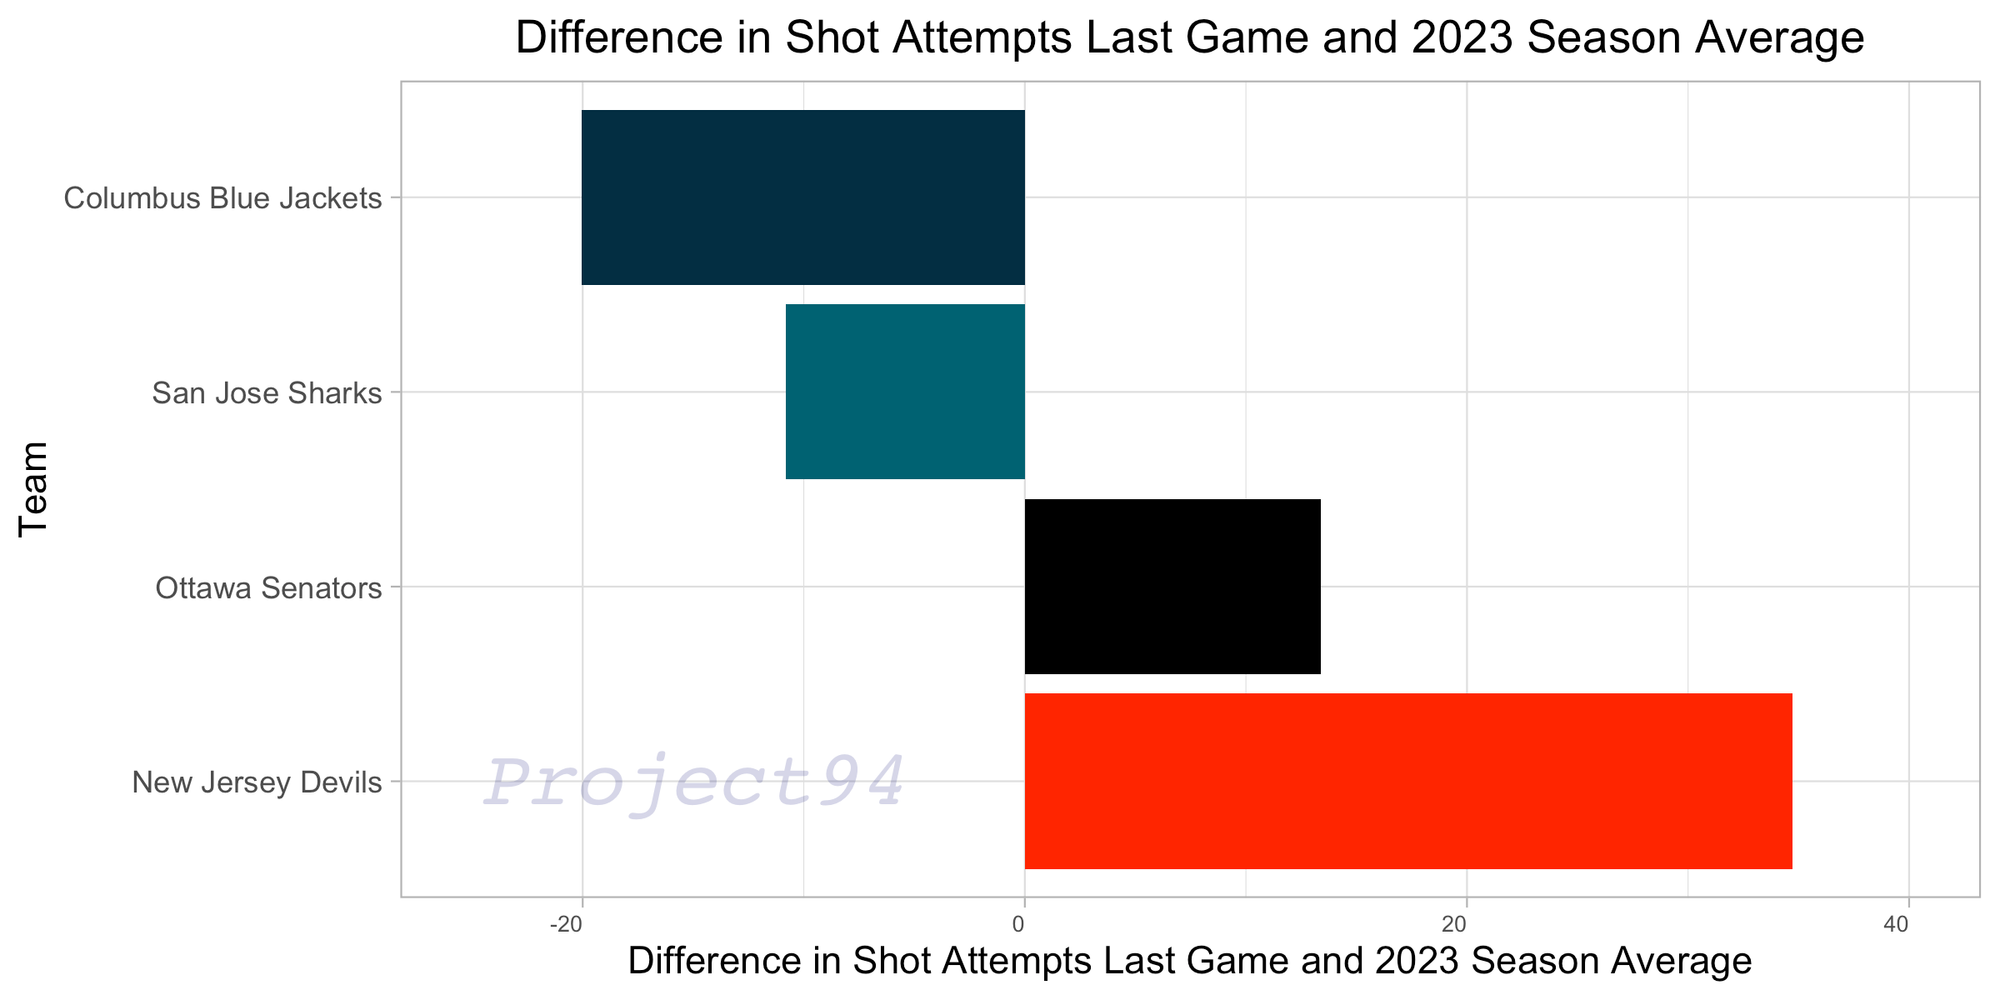
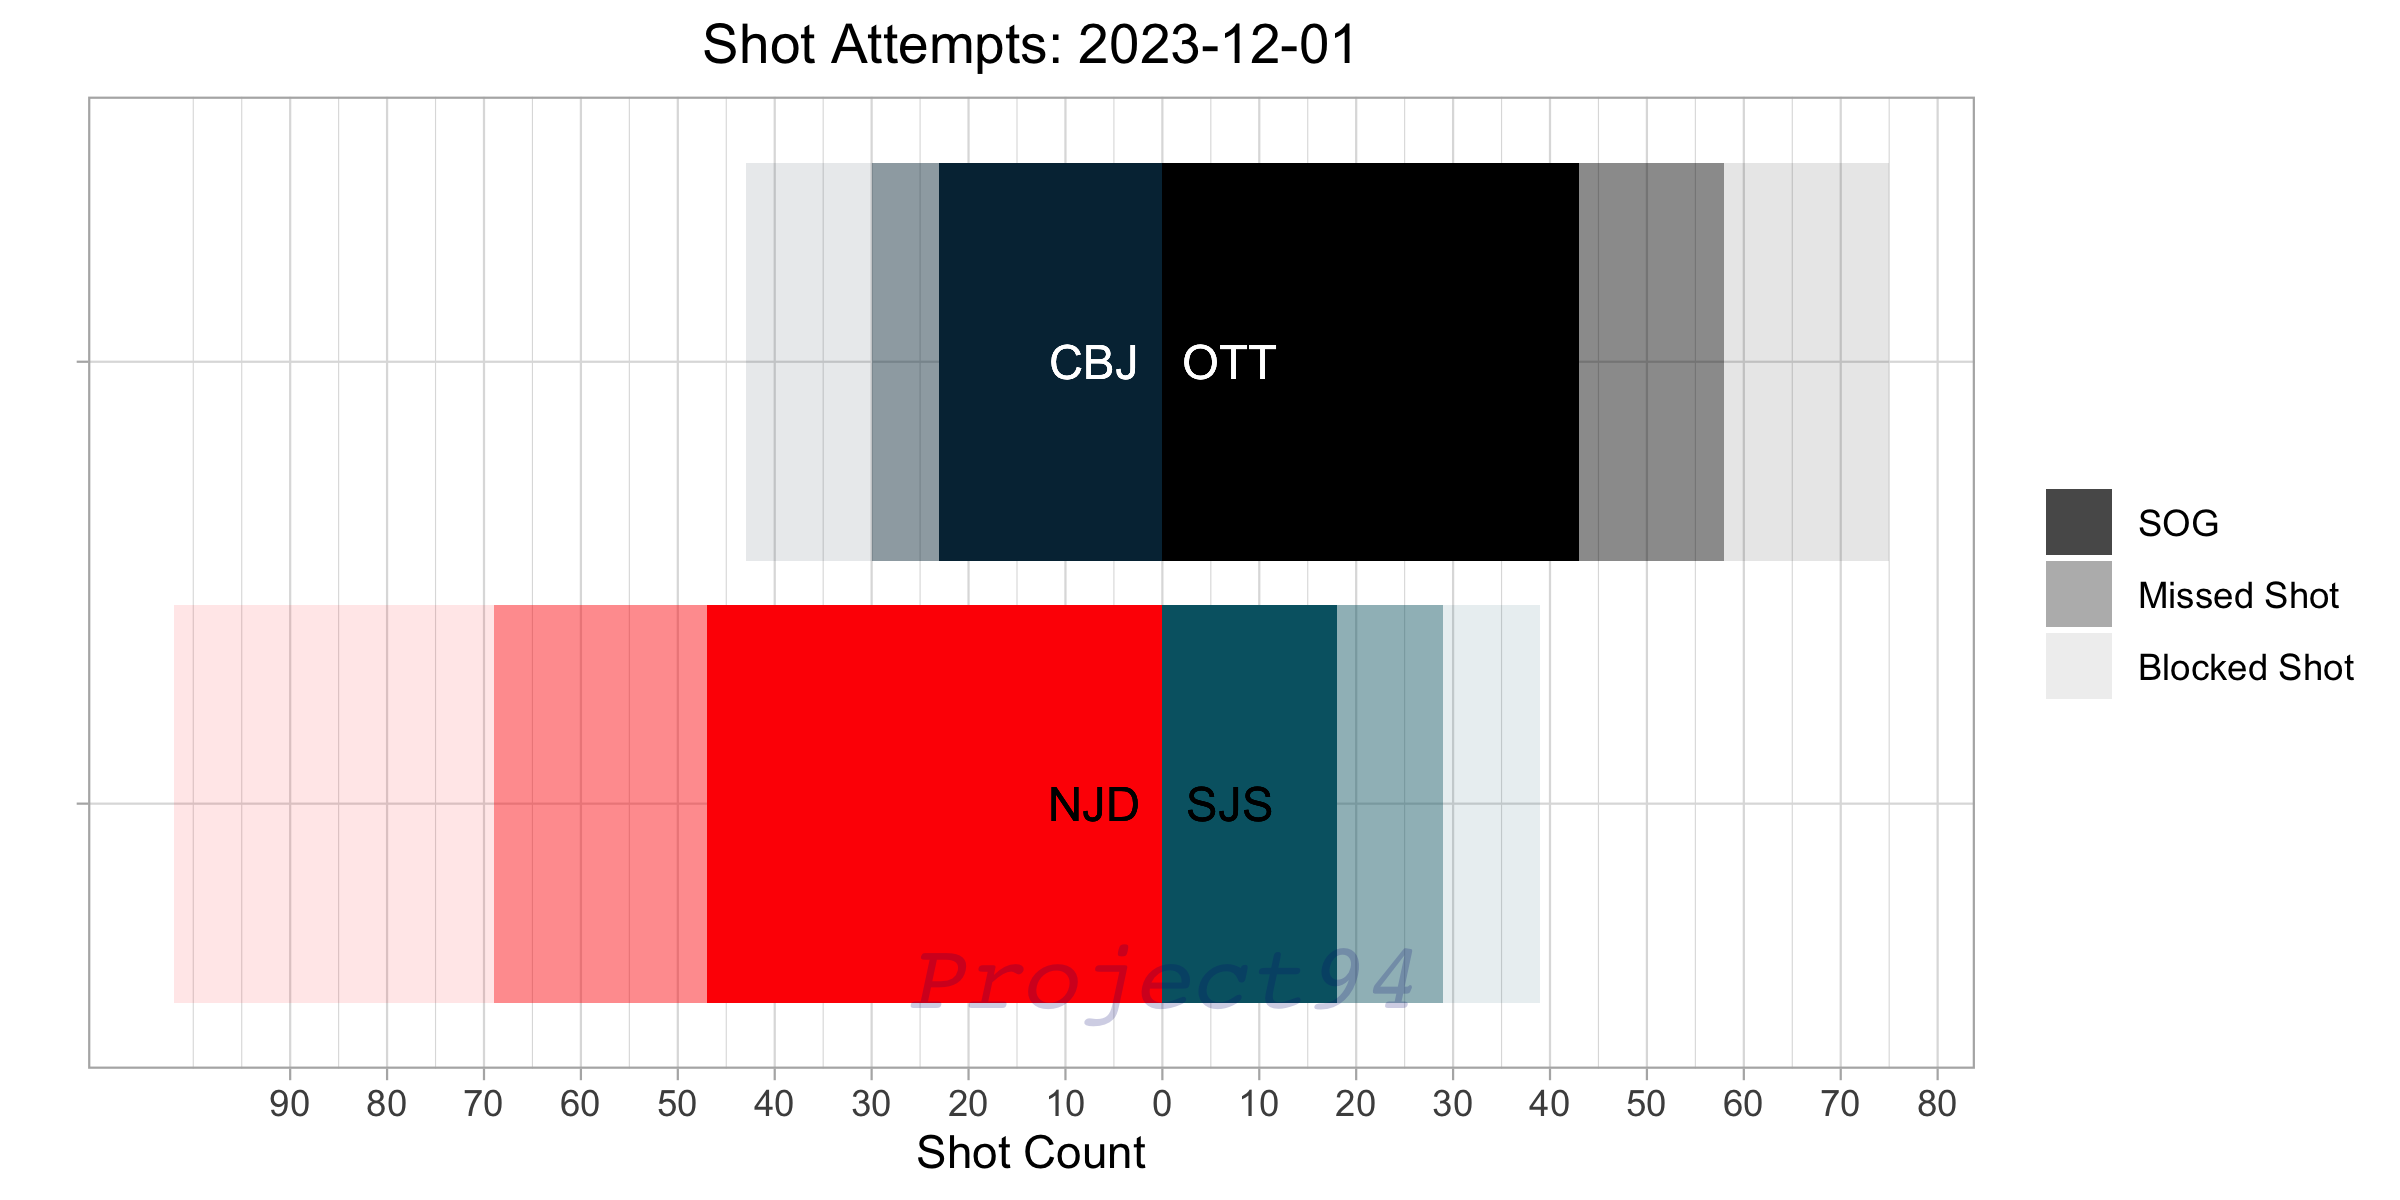
The Sharks win their 6th game in a big upset against the Devils as New Jersey is now 4-6 in their last 10 games.
Though they scored 6 goals (the most in a game this season), the Sharks only generated 18 SOG and 39 total shot attempts to the Devils' 47 SOG and 102 total shot attempts. That is tied for the largest difference in total shot attempts with the Islanders and Hurricanes on November 4th, except the Hurricanes (101 shot attempts) won that game.
Mikael Granlud had a goal and 2 assists for the sharks, reaching 10 points for the season, 2nd on the team.
Simon Nemec, in his NHL debut for the Devils, had 2 assists (1 at even strength), 3 SOG and 6 unblocked shots in 22.6 minutes of ice time.
The Blue Jackets defeated the Senators at home as Johnny Gaudreau scored twice and Zach Werenski had 2 assists, each recording just their 3rd multi-point night of the season.
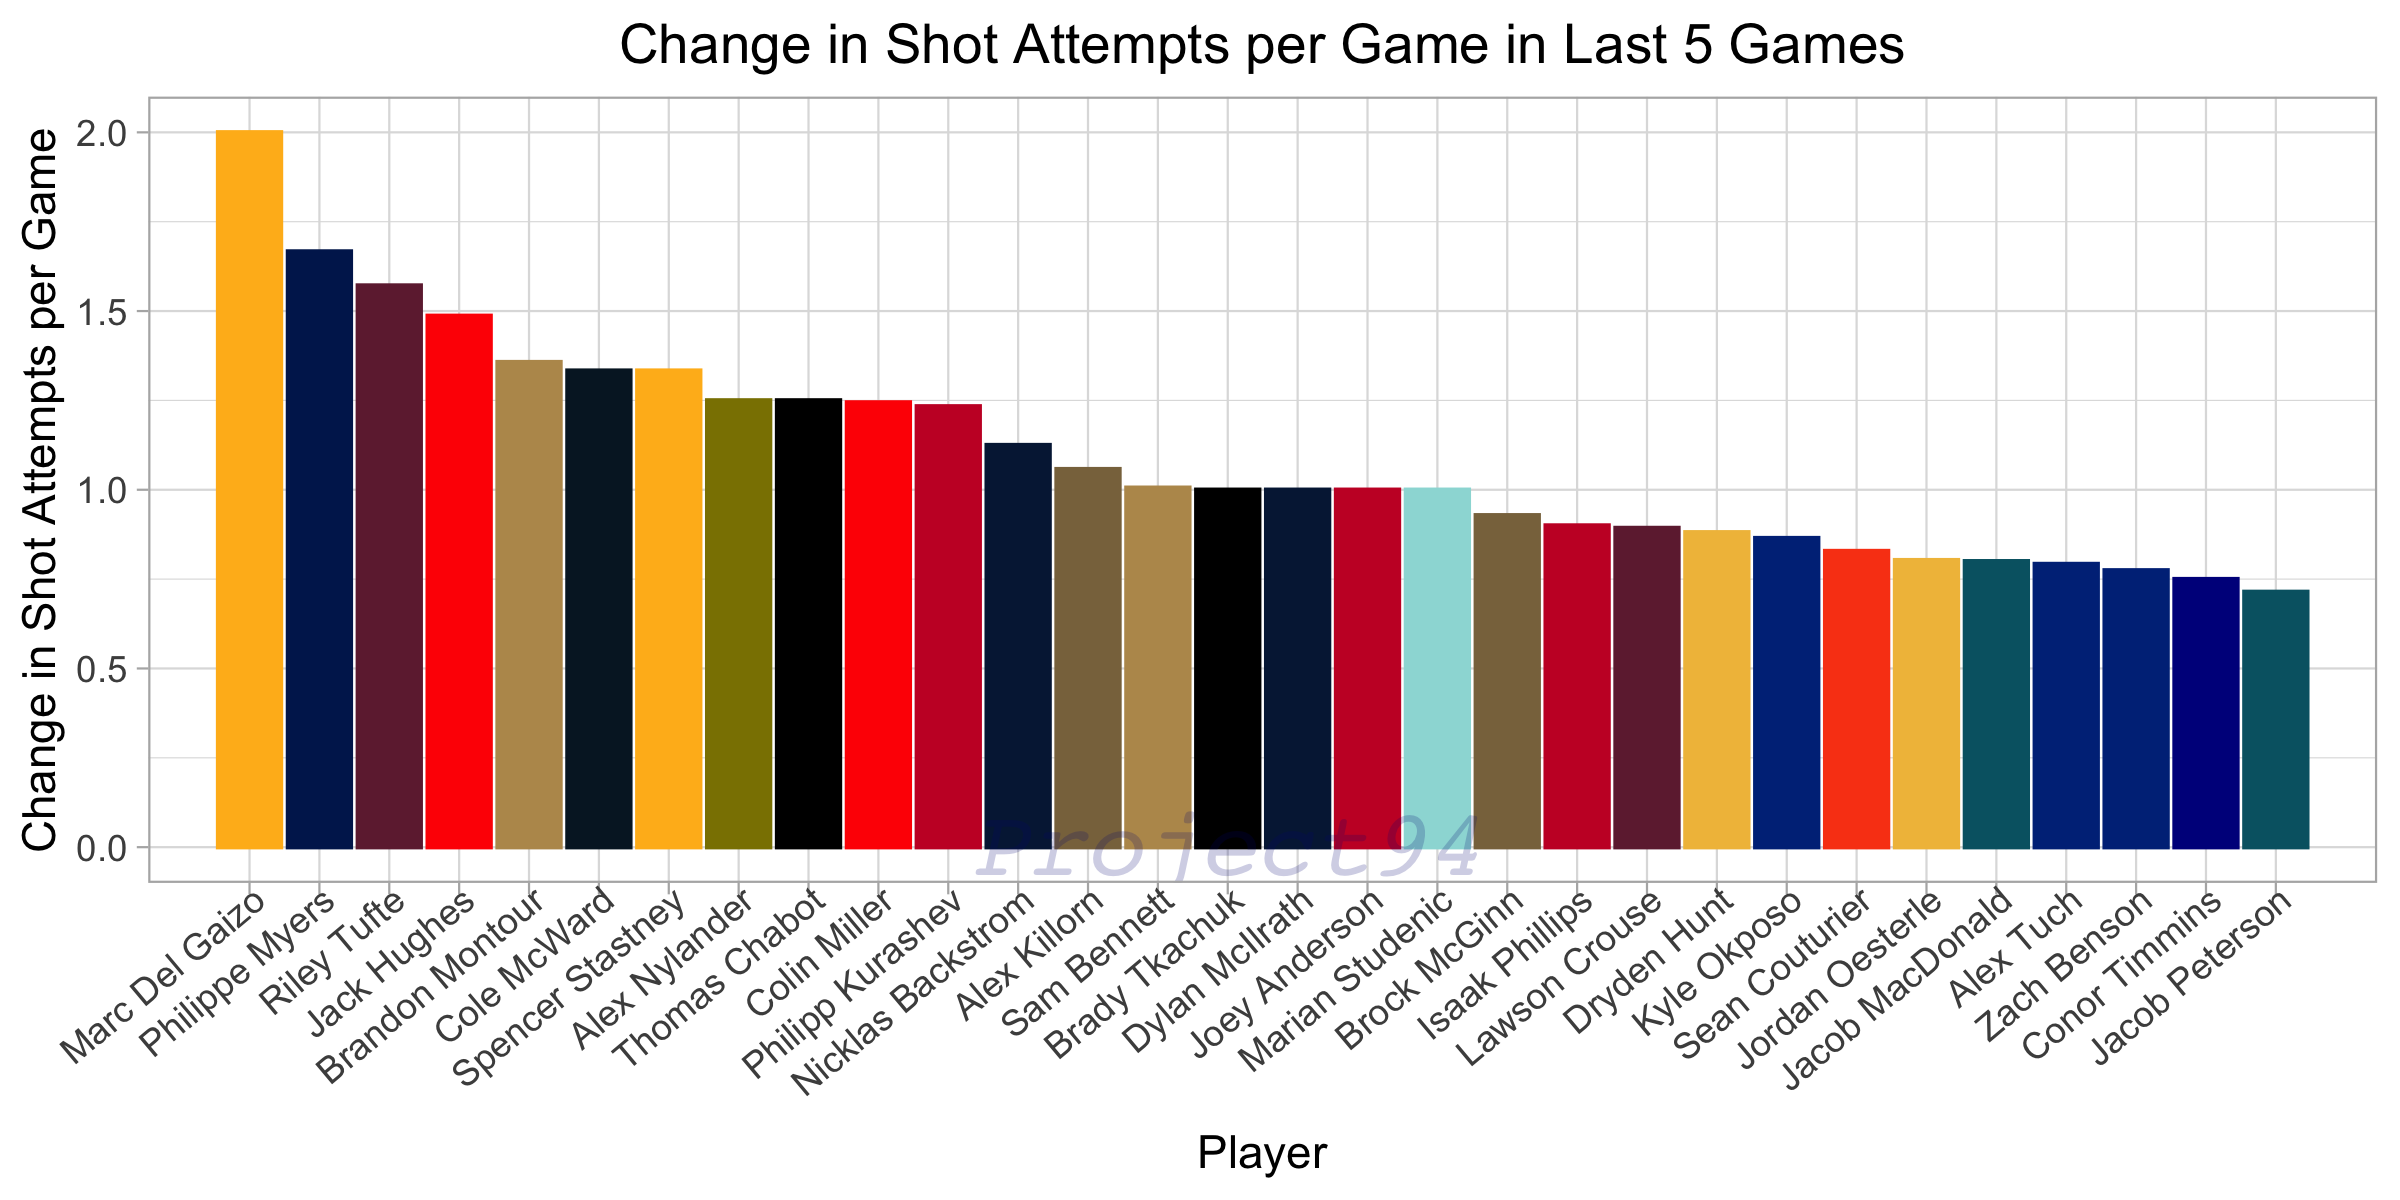
Brady Tkachuk's goal and assistn puts him at 3 goals and 2 assists in the last 5 games and has increased his Shot Attempts per 60 by 2.82 in those games.
Who's on Fire
Top 5 Teams
Team
Project 94 Rating
5 Game Trend
5 Game Win%
New York Rangers
699.362
+12.255
80.0% 🔥
Colorado Avalanche
662.387
+8.89
80.0% 🔥
Los Angeles Kings
659.212
+9.741
80.0% 🔥
Boston Bruins
645.734
-52.933
40.0%
Florida Panthers
631.696
-5.384
40.0%
Tonight's Matchups
Home Team
Home Win Probability
Away Team
Away Win Probability
Dallas Stars
67.0%
Tampa Bay Lightning
33.0%
Winnipeg Jets
69.1%
Chicago Blackhawks
30.9%
Nashville Predators
38.0%
New York Rangers
62.0%
Florida Panthers
66.4%
New York Islanders
33.6%
Montreal Canadiens
43.9%
Detroit Red Wings
56.1%
Toronto Maple Leafs
48.4%
Boston Bruins
51.6%
Ottawa Senators
58.4%
Seattle Kraken
41.6%
Carolina Hurricanes
59.2%
Buffalo Sabres
40.8%
Pittsburgh Penguins
57.4%
Philadelphia Flyers
42.6%
Arizona Coyotes
51.6%
St. Louis Blues
48.4%
Anaheim Ducks
27.0%
Colorado Avalanche
73.0%
Calgary Flames
49.9%
Vancouver Canucks
50.1%
Vegas Golden Knights
55.3%
Washington Capitals
44.7%
Subscribe to Project 94 Analytics
Don’t miss out on the latest issues. Sign up now to get access to the library of members-only issues.