16 games around the league plus in-depth matchup analysis for the games with wild card implications
Latest stats and analytics updates from games played as of 4/7/23
Original data sourced from mysportsfeeds.com
Win Probabilities for April 8th (16 games):
Home Team
Home Win Probability
Away Team
Away Win Probability
BUF
43.08%
CAR
56.92%
DET
55.353%
PIT
44.647%
DAL
47.523%
VGK
52.477%
SJS
27.394%
EDM
72.606%
ARI
55.69%
ANA
44.31%
WPJ
51.032%
NSH
48.968%
WSH
39.94%
FLO
60.06%
TOR
66.938%
MTL
33.062%
CBJ
32.866%
NYR
67.134%
OTT
47.271%
TBL
52.729%
NYI
62.686%
PHI
37.314%
MIN
58.966%
STL
41.034%
BOS
68.92%
NJD
31.08%
VAN
50.191%
CGY
49.809%
SEA
68.444%
CHI
31.556%
LAK
48.589%
COL
51.411%
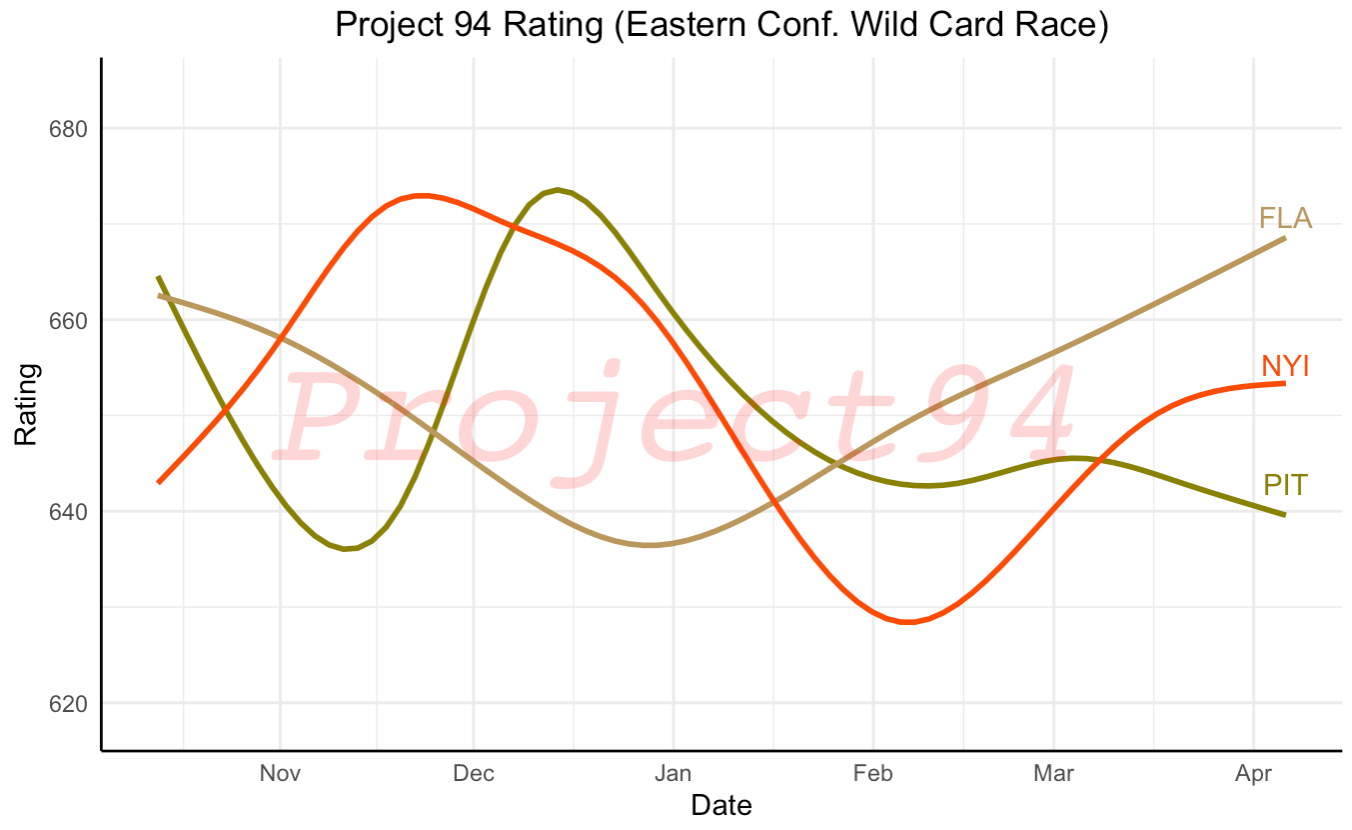
Eastern Conference Wild Card Race
Project 94 Ratings this Season for New York Islanders, Florida Panthers, Pittsburgh Penguinsc
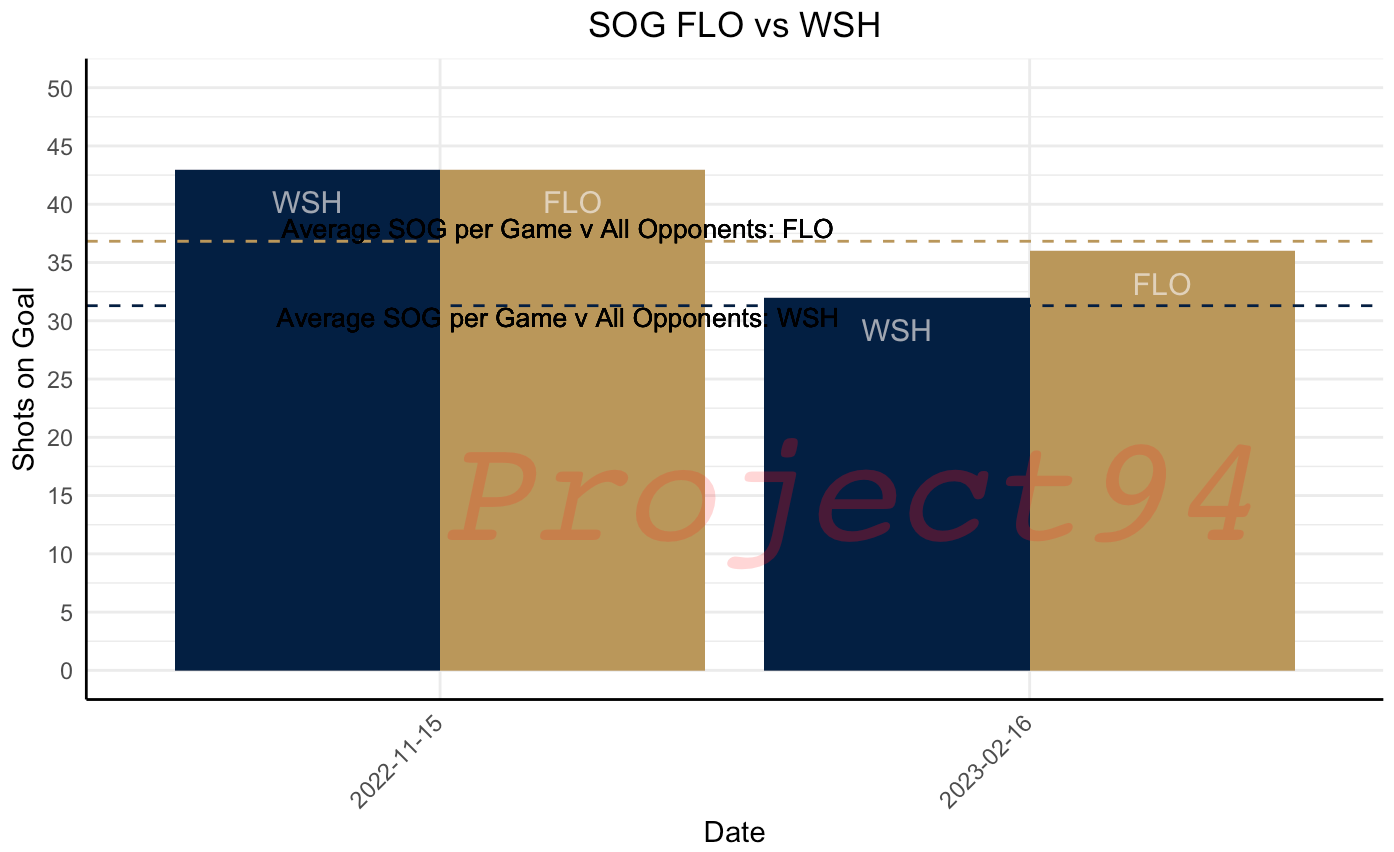
Florida Panthers (41-31-7)
Points: 89
Games Played: 79
Next Game: April 8th vs Washington Capitals
Win Probability: 60.06%
Last 5 GP Record: 5-0-0
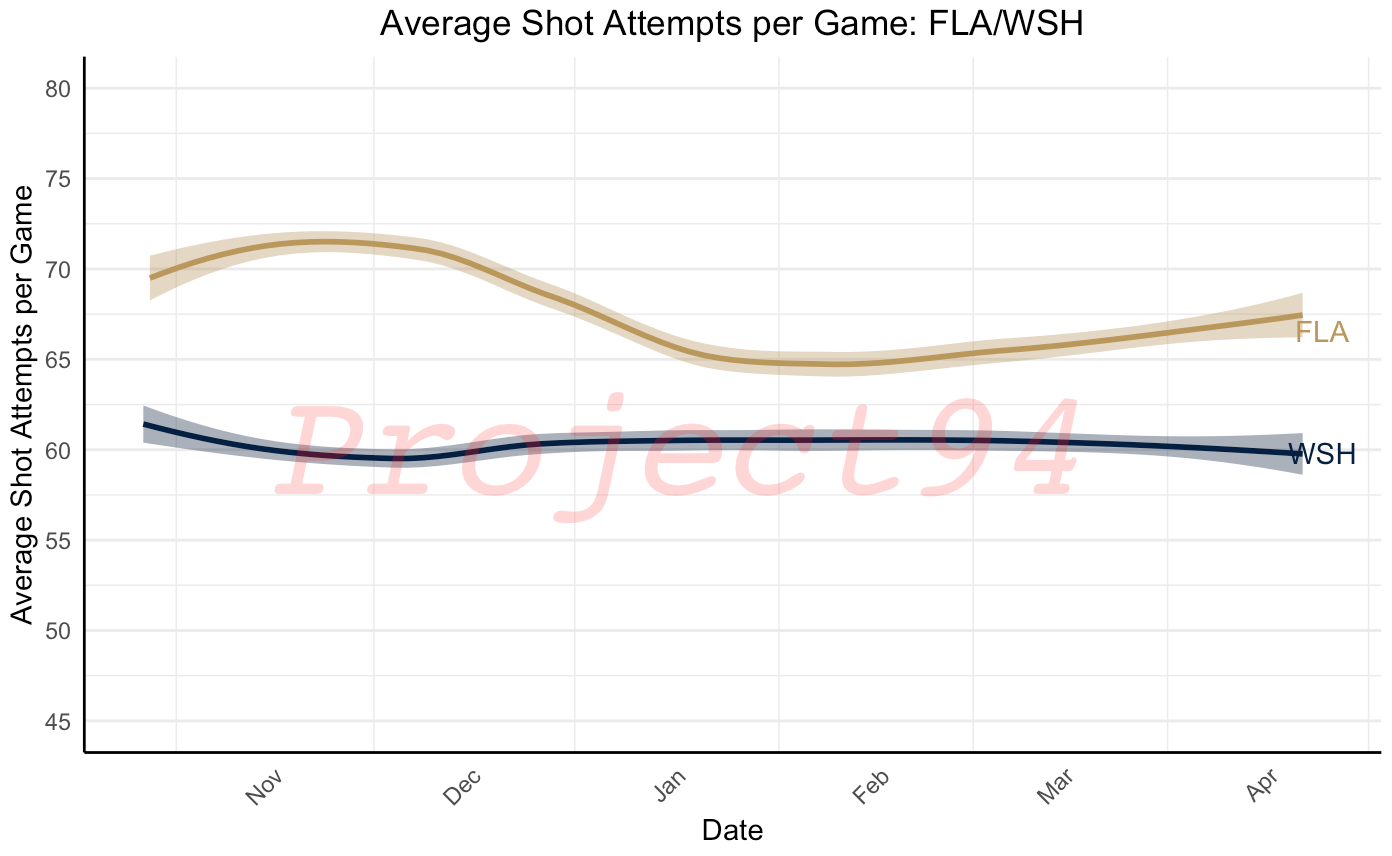
The Panthers average 66.5 Shot Attempts For per Game and 36.8 SOG For per Game
Washington averages 58.4 Shot Attempts Against per Game and 31 SOG Against per Game
Florida averages 3.5 Goals For per Game and are 32-2-5 when they score more than 31.5 goals per game while Washington averages 3 Goals Against per game, but are 3-25-4 when they give up 3.5 goals or more
The Panthers are 20-13-3 when they get at least 33.3 SOG, but the Wings are 10-8-4 when they give up 33.3 SOG or more
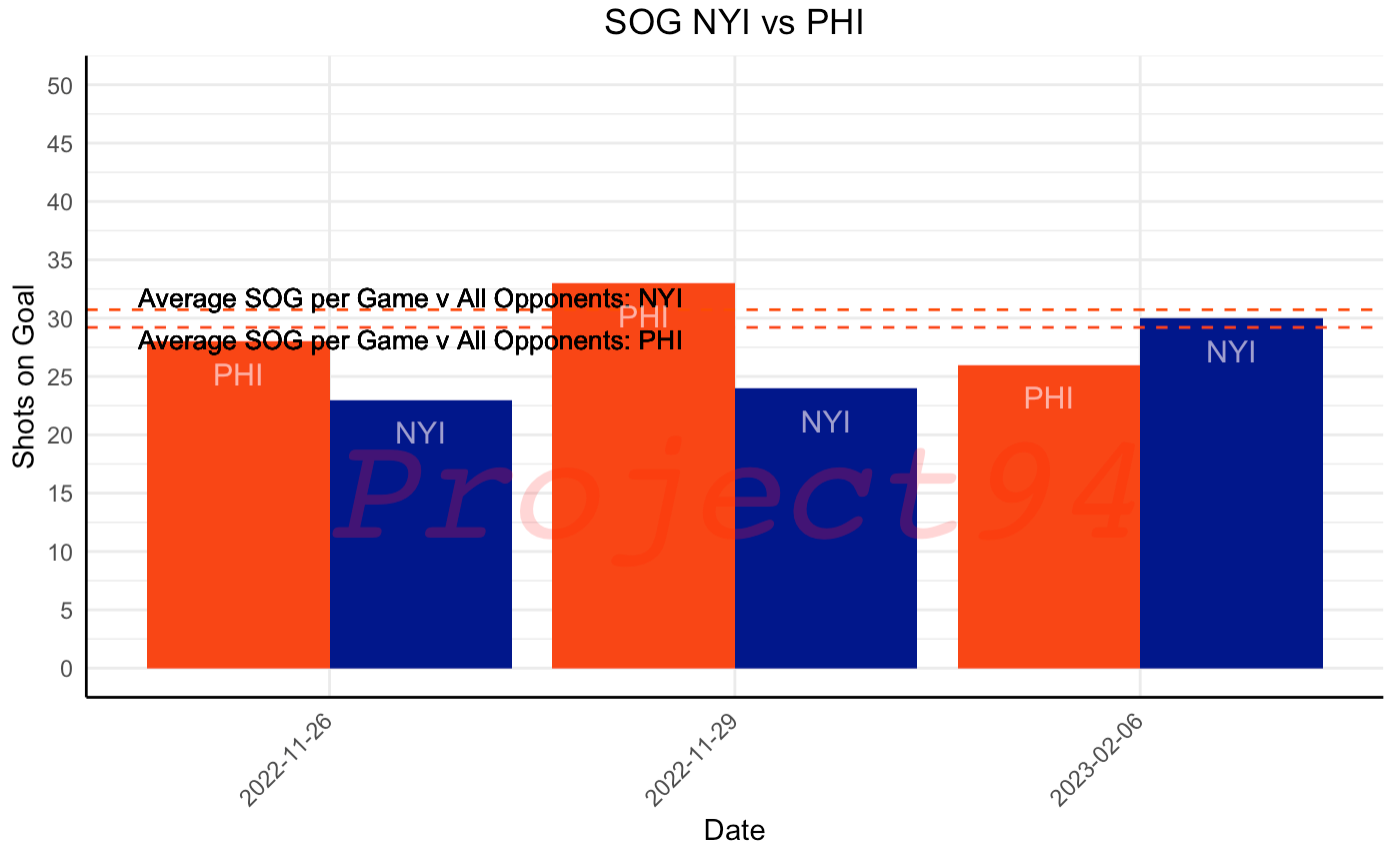
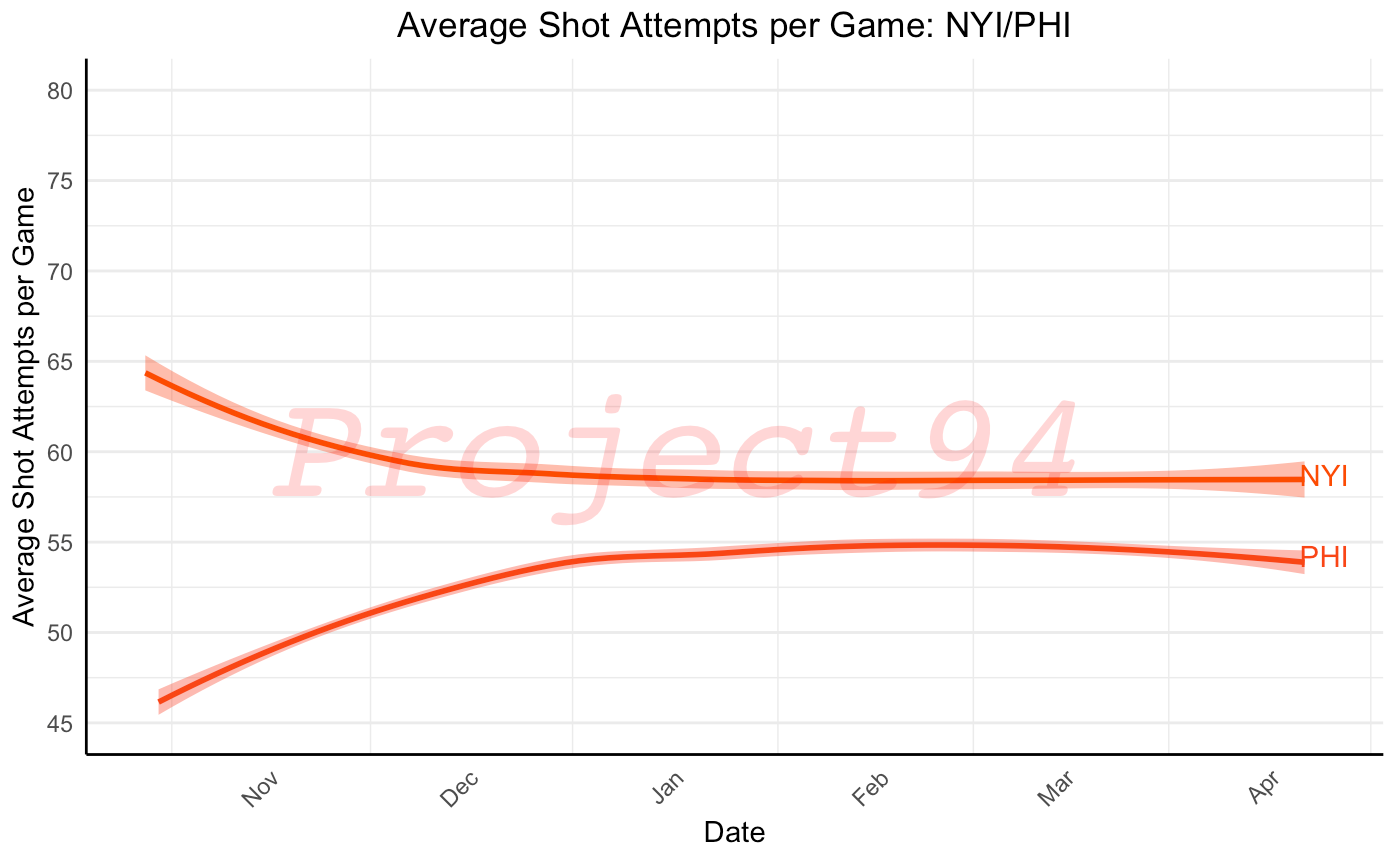
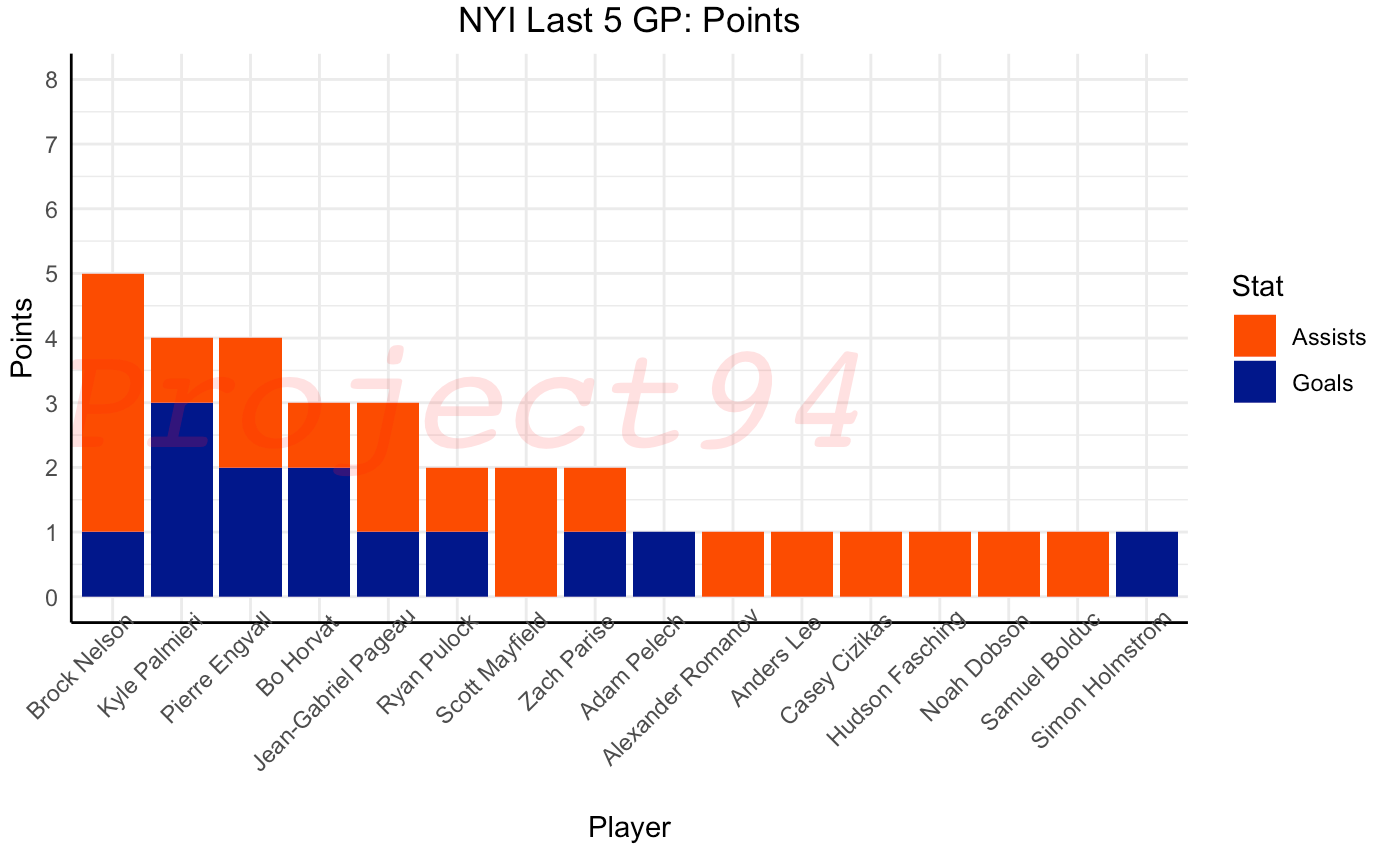
New York Islanders (40-30-9)
Points: 89
Games Played: 79
Next Game: April 8th vs Philadelphia Flyers
Win Probability: 62.69%
Last 5 GP Record: 3-2-0
Key Highlights
The Islanders average 2.94 Goals For per Game and the Flyers average 3.33 Goals Against per Game
The Islanders are 32-6-4 when they score 2.94 or Greater goals
The Islanders have won 2 of the 3 times the Flyers and Isles have met this season, though they outshout the Flyers only in the most recent game
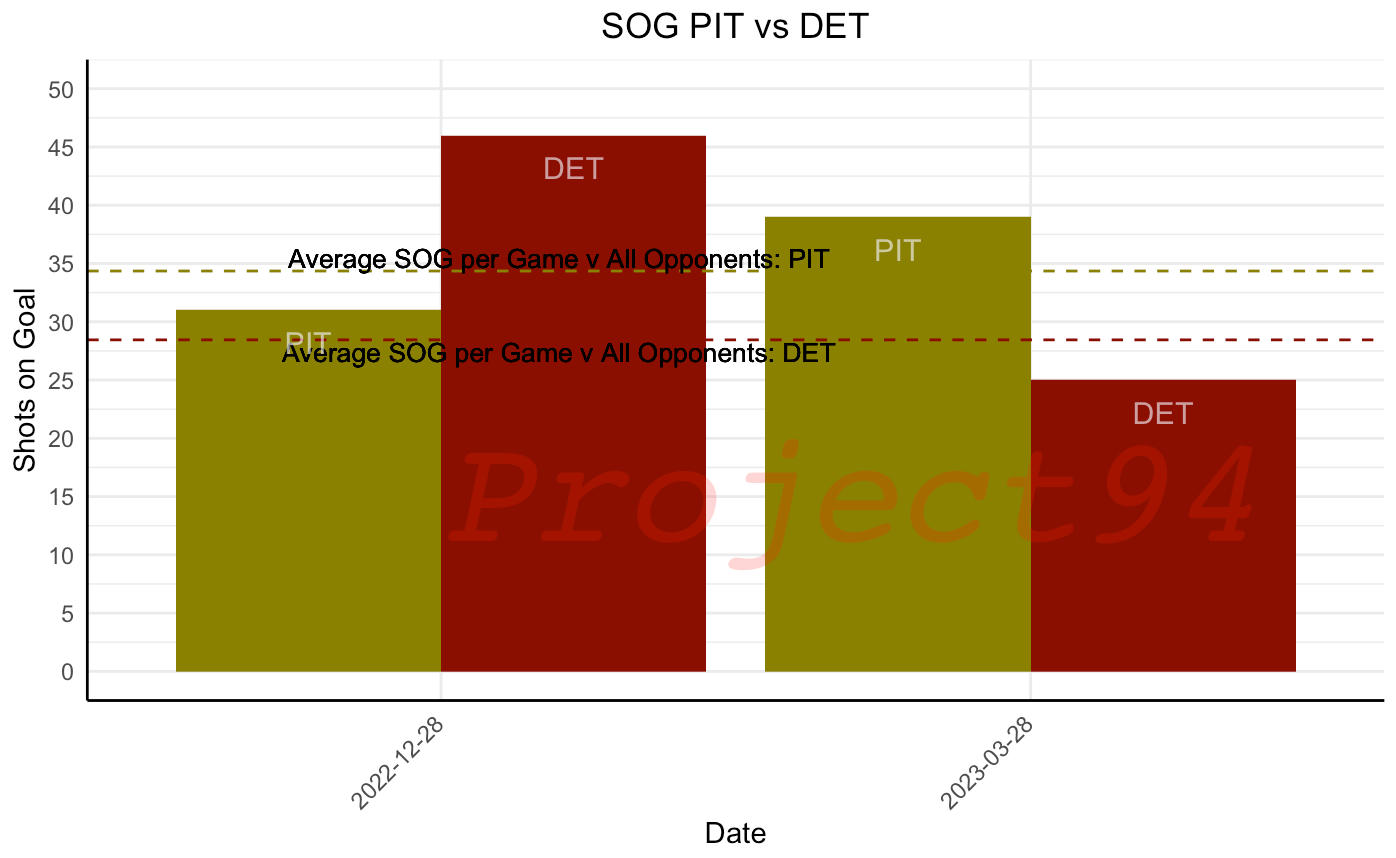
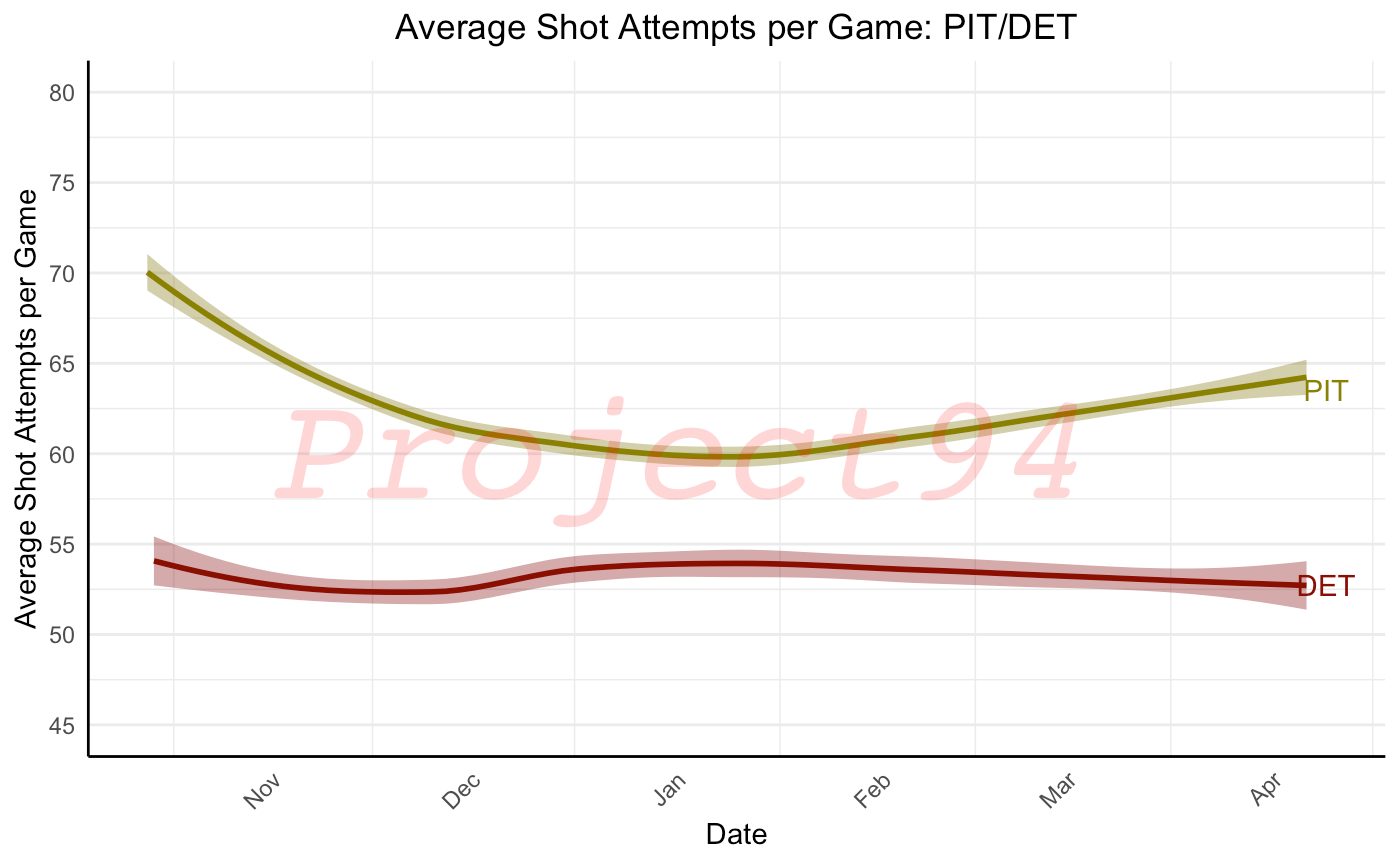
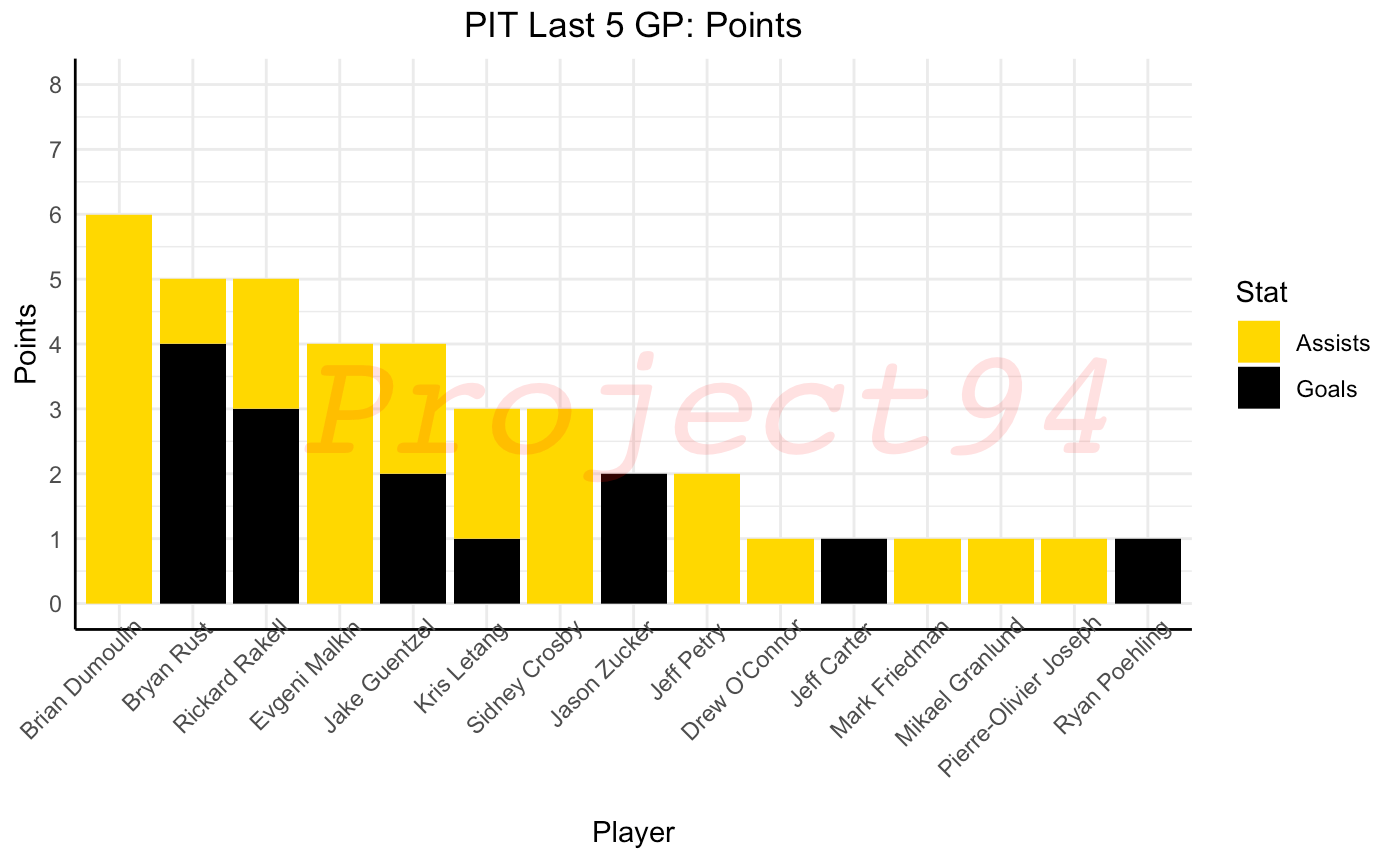
Pittsburgh Penguins (39-30-10)
Points: 88
Games Played: 79
Next Game: April 8th vs Detroit Red Wings
Win Probability: 44.65%
Last 5 GP Record: 3-2-0
Key Highlights
The Penguins average 63.5 Shot Attempts For per Game and 34.4 SOG For per Game
Detroit averages 59 Shot Attempts Against per Game and 33.3 SOG Against per Game
The Penguins are 20-13-3 when they get at least 33.3 SOG, but the Wings are 10-8-4 when they give up 33.3 SOG or more
Despite being outshot in 1 of the 2 games, Detroit has won both matchups vs the Penguins this season
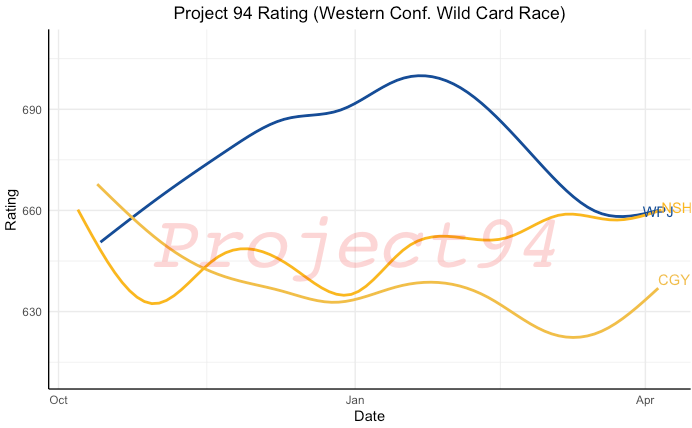
Western Conference Wild Card Race
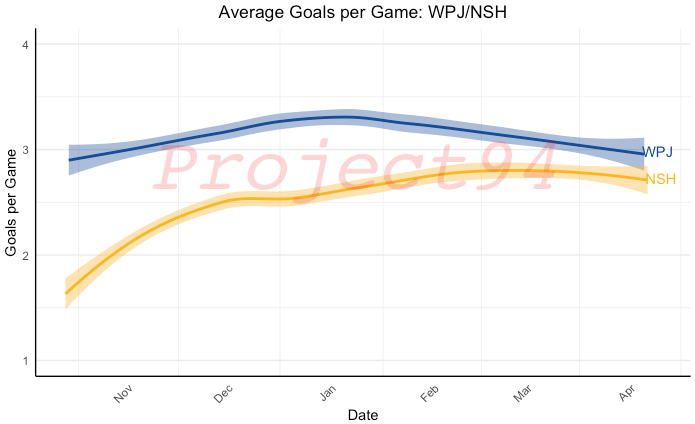
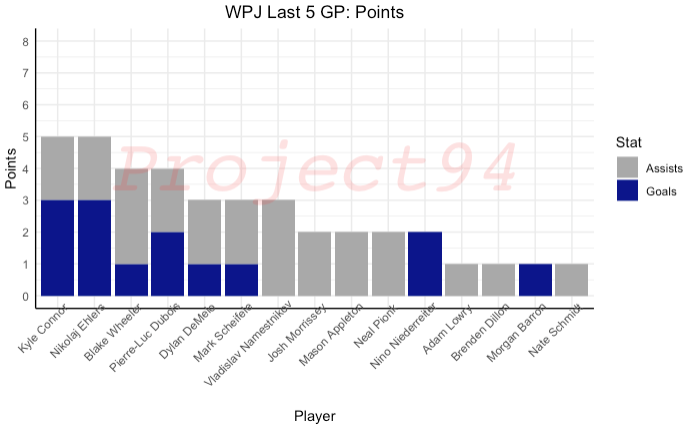
Winnipeg Jets (43-32-3)
Points: 89
Games Played: 78
Next Game: April 8th vs Nashville Predators
Win Probability: 51.03%
Last 5 GP Record: 2-3-0
Key Highlights
The Predators give up ~4 penalties per game and the Jets have a 19.4 Power Play Percentage
When the Jets have 4 or more powerplays in a game, ther are 19-9-1
The Jets average 38-4-1 when they reach their average Goals For per Game of 2.99 goals
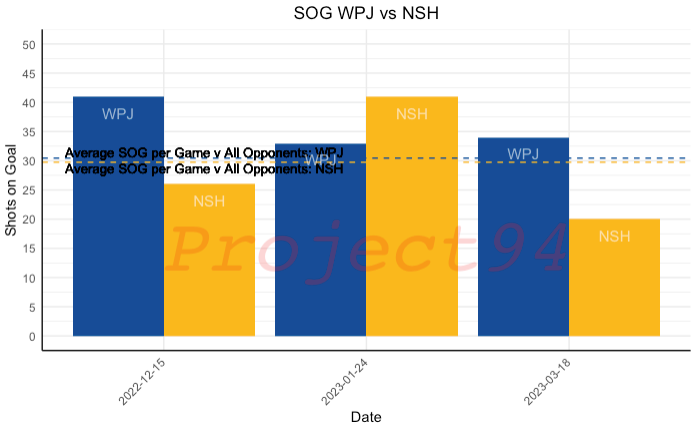
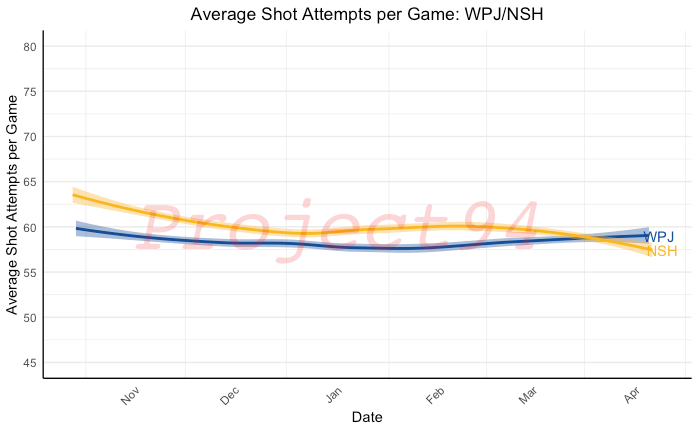
The Jets give up 6.5 less Shot Attempts per Game than the Predators
On average, the Predators have ~3.5 less SOG per Game than they're opponent and the Jets are 22-13-1 when they get more SOG than they're opponent
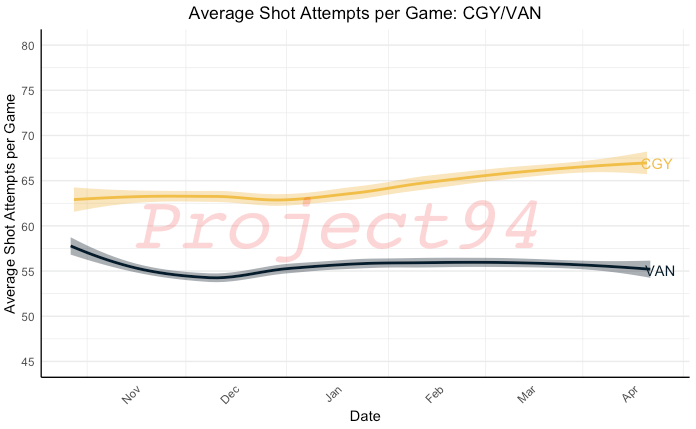
Calgary Flames (37-27-15)
Points: 89
Games Played: 79
Next Game: April 8th vs Vancouver Canucks
Win Probability: 49.81%
Last 5 GP Record: 4-1-0
Key Highlights
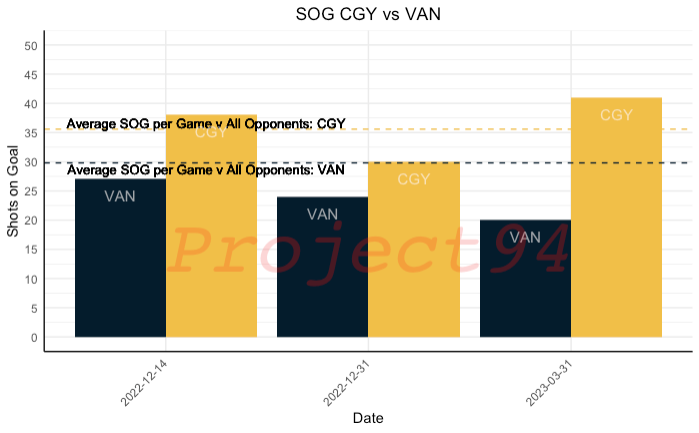
The Flames generate ~11 more Shot Sttempts per Game than the Canucks and around 6 more SOG per Game
When the Canucks give up more 35 SOG per Game (Flames average 35.6), they are 13-10-2
While still above 3.5 Goals per Game, Vancouver has improved their defense throughout the season, decreasing their Goals Against per Game Rate
The Flames have won 2 of the 3 matchups this season (1 win in regulation and 1 in OT), and 2 of the 3 games have required overtime or a shootout
The Flames are 7-18 when games have gone to overtime or a shootout
The Canucks are 12-9 when games have gone to overtime or a shootout
Nashville Predators (40-30-8)
Points: 88
Games Played: 78
Next Game: April 8th vs Winnipeg Jets
Win Probability: 48.97%
Last 5 GP Record: 3-2-0
Key Highlights
The Predators have decreased their Shot Attempts per Game throughout the Season, but are still 23-17-6 when they are outshot
Juuse Saros is 31-22 this season with an overall .918 save percentage but a save percentage of .8998 and a record of 12-8-2 when the Predators are outshot
Nashville is 7-1-2 when they give up their opponets 1 powerplay or less
Follow Project 94 on Twitter to get the latest stats and charts throughout the day and pregame
Disclaimer: Win probabilities and abstract analyses are predictions of future games and interpretations of historical events and should not be used as definitive outcomes for future games or events
Subscribe to Project 94 Analytics
Don’t miss out on the latest issues. Sign up now to get access to the library of members-only issues.